MK – NI 002


EMISSIONS OF OZONE PRECURSORS arrows p2
Definition

This indicator tracks trends in emissions of ozone precursors: nitrogen oxides, carbon monoxide, methane and non-methane volatile organic compounds, caused by anthropogenic activities, and each precursor is weighted by its tropospheric ozone-forming potential.

The indicator also provides information on emissions by sectors: energy industries; road and other transport modes; industry (processes and energy); other (energy); fugitive emissions; waste; agriculture and other (non-energy).


Units
  • kt (NMVOC – equivalent)
Key policy issue

What progress has been made in overall ozone precursors emissions reduction in Europe?

  • Emissions of ozone precursors in 2016 compared to 1990, have been reduced for nitrogen oxides (NOX) by51%, they have decreased for non-methane volatile organic compounds (NMVOC) by 43%, for carbon monoxide (CO) by44%, and an increase was recorded for methane (CH4), compared to 2014 (for which it has the latest available data) by67%.
  • With regards to nitrogen oxides, the decline in emissions since 2012 is a result of the reduced consumption of coal and fuel oil at thermal power plants for electricity production. In the last several years, the reduction of emissions is also a consequence of the reduced operation of REK Oslomej (namely, this installation starting from 2014 works only for one month in one calendar year). During 2016, the emissions of this pollutant were reduced as a result of the reduced consumption of coal in installations for electricity production, and because of the application of a national emission factor instead of the emission factor that was applied in the last few years.
  • With regards to volatile organic pollutants, in 2016 for comparison, the emissions of these pollutants are reduced to around 43%. The reasons for the decrease lie mainly in lower emissions from transport and the use of solvents. At the same time, the change in methodology from Level 1 to Level 2 for the last three years has led to a reduction in the emissions of this pollutant. From 2015 to 2016, emissions were reduced by 16%, due to the reduced use of solvents, and also due to slightly lower emissions from the household sector.
  • In 2016, CO emissions are reduced by 15% compared to 2015 and amounted to 74 kt. The reduction of CO emissions in 2016 is also noticeable, compared to 2015, as well as a continuous decline in emissions starting from 2012, especially in the sector od household heatingand administrative buildings, due to reduced consumption of wood at the expense of increasing consumption of natural gas and pellets.
  • CH4 was the only pollutant among ozone precursors where increase in emission was recorded in the followup years as a result of increased emissions from the waste sector resulting from increased population and slow implementation of the waste strategy.

The Diagram below shows annual trend of carbon monoxide, methane, non-methane organic compounds and nitrogen oxides emissions presented as ozone precursors.

Diagram 1. Total ozone precursors emissions

CSI_Vozduh2018_002_g1EN

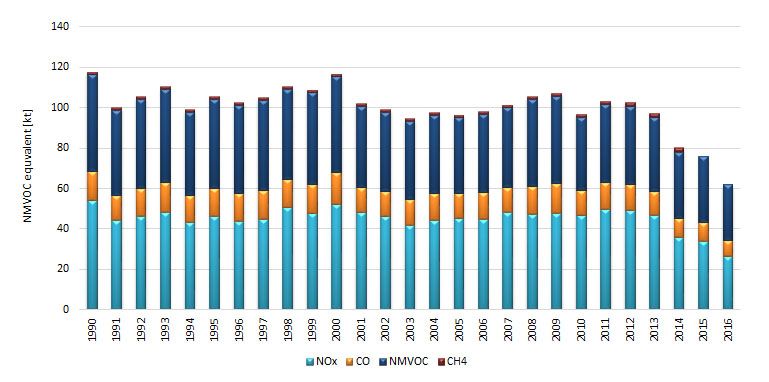
The Diagram indicates that decrease in overall ozone precursors can be noted as of 2011, with the trend being almost unvariable in the preceding period.

Assessment

Under the CARDS Programme, Inventory of air emissions of the main pollutants in the country was established in 2005 in accordance with the EMEP methodology by individual sectors, i.e. activities, and in 2014 an Inventory including all pollutants was prepared.Starting from 2014, the Republic of Macedonia carries out calculations of national emissions for all pollutants.

The emission sources, within this national indicator, are made according to the following categorization:

Sector
Energy Production and distribution
Commercial, instiucional and households
Industry (combustion)
Industry (production)
Fugitive emissions
Use of solvents and products
Road transport
Non-Road transport
Waste
Agriculture
Other

Data used in the calculation of ozone precursors was taken from the Inventory of air pollutant emissions by sectors or activities prepared in 2016 when recalculation of emissions for the whole period of 1990-2014 was made.

Inventory of methane as one of ozone precursors is made by IPPC methodology. In the frames of the Third National Communication on Climate Change, the GHG Inventory was made for the period 1990-2014 and data on methane emissions by sectors ws taken from there.

Completed inventory of ozone precursors indicates dropping trend during the analyzed period.

Changes in the quantities of NOx and CO emissions in transport sector resulted from the change in consumed quantities of diesel fuels and petrols by passenger cars. In this sector, vehicle fleet keeps renewing from year to year, though the number of used cars increases thus resulting in absence of significant emissions reduction from the traffic. At the same time, it should be emphasized that the methodology for calculation of emissions at level 2 has been applied in the last three years, which also leads to reduction of the emissions of all pollutants. It is necessary to use a higher level of calculation for the whole period, which would make a more realistic assessment of the trend of emissions from the traffic sector.As far as reduction in NOx emissions from the energy sector is concerned, the implementation of IPPC Directive and introduction of the best available techniques in heat production installations, as well as modernization of electricity production plants in 2013, reduction in emissions of this pollutant from energy sector was recorded upon 2013. Also, the reduced consumption of coal and heavy oil and the reduced production of electric energy with existing energy production capacities leads to a reduction in the emissions of pollutants emanating from this sector.The amount of CO emissions from non-combustion facilities like households, depends mainly from the use of wood for heating. These emissions have been decreasing in recent years due to the reduced consumption of wood and increased consumption of pellets and natural gas. In the future, it is expected that there would be further reduction of emissions from this sector due to the expansion of the national gasification network. It is expected that CO emissions would be reduced in future through the introduction of a nation-wide gasification system.

Directive 1999/13/EC regarding NMVOC emissions from solvents use in installations and certain activities has been partially transposed (only for limit values) in the national legislation, and reduction schemes for these pollutants have not been introduced. Full transposition of this Directive is planned by the end of this year. On the other side, transposition of Directives 1994/63/ЕCand 2009/126/EC concerning emissions from petrol filling and distribution to petrol stations is in final stage and implementation of the Law on Control of Volatile Organic Compound Emissions at petrol use has commenced. Namely, registration of installations for storage, installations for filling and emptying of mobile containers and petrol stations in accordance with the adopted rulebook is underway.

Yet, reduction in NMVOC emissions from the implementation of the adopted and planned legislation is expected to be achieved in the coming years.

With regard to greenhouse gas methane, overall emissions have increased due to emission increase in waste sector owing to the trend of growth in the quantity of solid waste. Emission of methane from the agriculture sector has showed a declining trend. Reduction in the emission of this pollutant is expected upon the implementation of the waste legislation.


Specific policy issue

Which different sectors and processes contribute to ozone precursors emissions?

Diagram 2. Total NOx emissions by sectors/year

CSI_Vozduh2018_002_g2EN
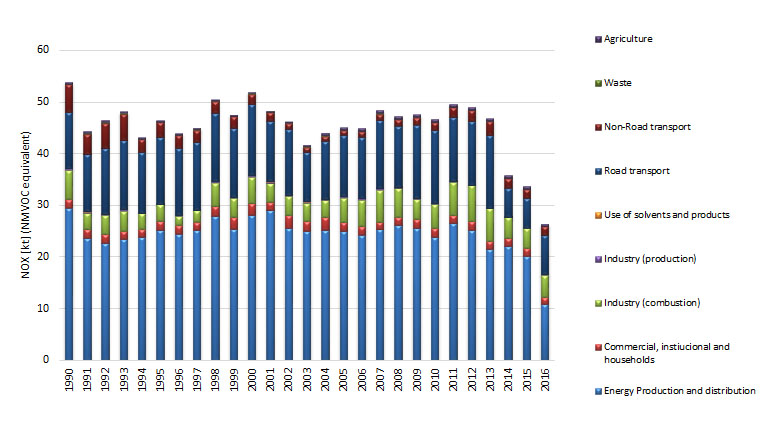
Diagram 3. Total CO emissions by sectors/year

CSI_Vozduh2018_002_g3EN

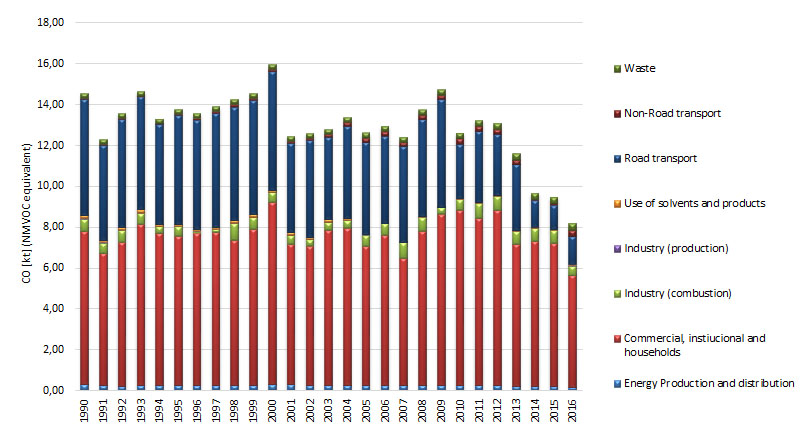
Diagram 4. Total NMVОC emissions by sectors/year

CSI_Vozduh2018_002_g4EN

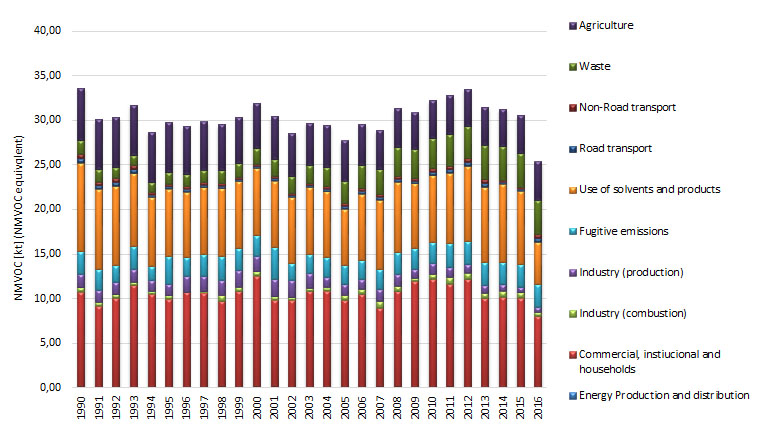
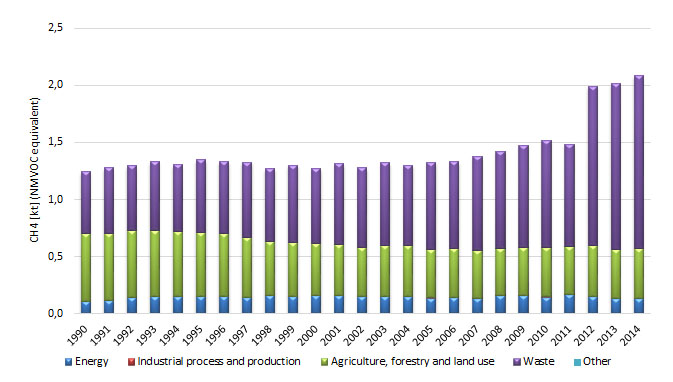
Diagram 5. Total CH4 emissions by sectors/year

CSI_Vozduh2018_002_g5EN

 Data coverage: excel

Source of data: The data on NMVOC, CO and NOx as overall national emissions and emissions categorized by NFR was taken from the following web site: http://cdr.eionet.europa.eu/mk/un/clrtap/inventories/envwovm7g/ , posted in February 2018. Data on CH4 emissions was taken from the Inventory of GHG accessible at the following web site: http://cdr.eionet.europa.eu/mk/un/unfccc/envwo3zfg/.

Nitrogen oxides (NOx)

The main sources of emissions of this polluting substance in 2016 were the following sectors of sources: Road transport with a share of 31% (22% in 1990) and Energy production and distribution with a share of 41% (55% in 1990) in the overall national NOx emissions.

Carbon monoxide (CO)

Almost all emissions of CO originate from Commercial, institutional and householdssector with a share of 67%, road transport with share of 17%, and less from the sector Industry (Combustion) with a share of 9%. The reason for the reduction in the emissions in the period 1990 to 2016 is related to the reduced emissions from the Road transport sector. From 2015 to 2016, emissions havedeclined by 14%, mainly due to lower consumption of fuel wood.

Nonmethane volatile organic compounds (NMVOCs)

The main sources of NMVOCs emissions in 2016 were the sectors Commercial, institutional and households, Industry (production) and Road transport.Reduction of emissions of these pollutants (NMVOCs) is recorded in all sectors, with exception of the waste sector, from which the emissions are increasing.

Methane (CH4)

With regard to methane emissions, categorization was made in several sectors: waste, industry, agriculture, energy and other. Throughout the reporting period, emissions from the sector waste were the highest and increasing for the last several years. The sector Agriculture, forestry and land use is the second key sector with significant share in methane emission, followed by energy sector.

Methodology
  • Methodology for the indicator calculation

The methodology for this indicator calculation is based on aggregation and calculation of data on CO, NMVOC, CH4 and NOx emissions at annual basis, on national level, as overall and distributed to sectors, i.e. activities.

Calculations are in line with EMEP/EEA Guidelines and methodology for inventory and application of the SNAP – selective nomenclature of air pollution.

With regard to this specific indicator, factors have been used in order to express the property of ozone precursors. These factors are specific to each pollutant, namely for NOx it is 1.22, for NMVOC it is 1, for CO it is 0.11 and for CH4 this value is 0.014. The results are expressed in kilotons NMVOC equivalent.


  • Reference of used methodology

Methodology applied in the calculation and presentation of this indicator has been taken from the EMEP/EEA Guideline on air pollutant emission inventory 2013, Technical Report no. 12/2013, EEA. and deLeeuw, F. (2002). Set of emission indicators of long-range transboundary air pollution, Environmental science and policy.

Policy relevance of the indicator

The European Partnership Action Plan has been adopted, as well as the National plan for approximation of the national legislation with the European regulations stating the bylaws that need to be prepared.

NEAP II has been prepared, specifying the measures that need to be taken to improve the overall status of air and in that sense to reduce emissions leading to acidification. The National Ambient Air Protection Plan 2012-2017 has been adopted, and it contains measures for air protection on national level and the National program for gradual reduction of emissions until 2020 in order to define and implement measures on national level concerning introduction of renewable sources, application of the code of good agricultural practice, technical control of vehicles at registration, application of the best available techniques in industrial facilities, etc., as well as technical control and on road checks. At the same time, for the purpose of air quality improvement in certain local self-government units (LSGUs) with action plans, an air quality improvement program was prepared for the City of Bitola. Air quality plans and short term action plans for city of Skopje and city of Tetovo are prepared in the Twining project “Further strengthening of the capacities for effective implementation of the acquis in the field of air quality”, which were adopted by the councils of the municipalities.Additionally the municipality of Veles also has prepared and adopted an Air Quality Plan in November 2017.

A National Plan for the reduction of emissions (NERP) of sulfur dioxide (SO2), nitrogen oxides (NOx) and dust from the existing large combustion plants in Republic of Macedonia has been prepared. The plan was approved by the Energy Community and the revised plan was adopted by the Government of the Republic of Macedonia in December 2017. Starting from January 2019, Republic of Macedonia should report on the quantities of total emissions resulting from large combustion installations in order to determine the compliance with the defined ceilings in NERP.

All 8 Protocols to the Convention on Long-Range Transboundary Air Pollution (CLRTAP) were ratified in 2010. With regard to the last three Protocols, i.e. Protocol on heavy metals, Protocol on POPs and Gothenburg Protocol, National Action Plan for Ratification and Implementation was adopted at their request. Due to the requirement for modifications in contributions related to emissions in baseline year (1990) and national emission ceilings for 2010, the Gothenburg Protocol and Protocol on sulfur of 1995 entered into force for the Republic of Macedonia in 2014, upon the adoption of the values specified in Annex II to these Protocols.

In order to fulfill one of the basic requirements under the Protocols to CLRTAP, Inventory of Air Pollution is prepared on regular level by EMEP/EEAMethodology and the prepared inventory is reported to UNECE and CLRTAP and European Environmental Agency.

With regard to fulfillment of the requirements of the Stockholm Convention covering the same pollutants specified in the Protocol on POPs, the National Implementation Plan for old and new organic pollutants was updated and Inventory of old and new POPs chemicals was prepared.


Legal grounds

The Law on Ambient Air Quality was adopted in August 2004 and amended several times afterwards (Official Gazette of RM no. 67/2004, 92/2007, 83/2009, 35/10, 47/11, 100/12, 163/2013,10/2015 и 146/2015) as framework law in the area of air. The goals of this Law include avoiding, prevention and reduction of harmful effects on human health and environment as a whole, prevention and abatement of pollutions leading to climate change, as well as provision of appropriate information on the quality of ambient air.

On the basis of the Law on Ambient Air Quality, 16 bylaws were prepared and adopted to introduce limit values for air quality and air emissions for NMVOC, CO and NOx, methodology of air quality and air emissions monitoring, manner of preparation of planning documents for air protection against pollution, manner of informing the citizens and international organizations, etc.

With reference to air standards transposed in part of the mentioned rulebooks, all ISO and CEN standards and their amendments in the area of air emissions and air quality were adopted by means of endorsement method.

Other legislation related to the regulation of air quality and air emissions regulation includes the Law on Vehicles, Rulebook on liquid fuels quality with national standards for liquid fuels quality, etc.

In 2010, all 8 Protocols to the Convention on Long-Range Transboundary Air Pollution – CLRTAP were ratified.

In relation to the obligations for calculation of emissions of non-methane volatile organic compounds (NMVOCs), the following protocols or international ratified agreements are of relevance:

Protocol to 1979 Convention on Long-Range Transboundary Air Pollution concerning concerning control of emissions of non-methane volatile organic compounds or their transboundary transfer. The Protocol was ratified by the Law on Ratification (Official Gazette of RM no. 24/2010);

Protocol to 1979 Convention on Long-Range Transboundary Air Pollution concerning reduction of acidification, eutrophication and ground ozone. The Protocol was ratified by the Law on Ratification (Official Gazette of RM no. 135/2010).

The latter Protocol is also relevant for nitrogen oxides, and the older Protocol to 1979 Convention on Long-Range Transboundary Air Pollution concerning concerning control of nitrogen oxides releases or their transboudary transfers (Official Gazette of RM no. 24/2010).


Targets

Does any of the national documents set targets or targets set under international documents should be achieved?

National strategic documents listed as references in the above text provide guidelines and specify actions that should be undertaken as a matter of priority. It is important to mention that the new regulations in the area of air emissions have been adopted transposing the following Directives into the national legislation: 96/61/ЕC, 2000/81/ЕC, 2000/76/ЕC, 99/13/ЕC and 2001/81/ЕC and the level of transposition is 90-100%.

In accordance with the requirements of the UNECE Convention on Long-Range Transboundary Air Pollution, inventory taking was introduced based on the EMEP/EEA Guideline on air pollutant emission inventory aimed at regular inventory of pollutants in tonnes per year following n-2 principle where n is the current year.

Also in accordance with Directive 2001/81/ЕCand Gothenburg Protocol, the upper limits-ceilings of the amounts of emissions have been set at the level of the Republic of Macedonia for 2010 that shall not be exceeded at 2010 annual level. The Executive Body of the Convention on Long-Range Transboundary Air Pollution, upon submission of the values of national ceilings in order to enroll the Republic of Macedonia in Annex II of the Gothenburg Protocolrequested correction of the values considering the reported data on air emissions of the pollutants sulfur dioxide and ammonia at national level. Changes in the values of these pollutants were incorporated in the Rulebook amending the Rulebook on upper limits – emission ceilings of pollutants for the purpose of setting projections for certain period concerning reduction of the quantities of pollutant emissions at annual level published in July 2014. In 2016, national upper limits – ceilings for NOx and NMVOCs were not exceeded.


Upper limit – ceiling Total emissions-2016
NMVOC 30 Gg 27,5
NOx 39 Gg 21,6

With regard to targets – emission projections for NOx forthe year 2020, under the scenario with measures, are estimated to be 23,8 Gg, and thisemission level has already been achieved in 2016. With regard to targets – emission projections for NMVOC for 2020 set in the Programme for gradual reduction of emissions of certain polluting substances at the level of the Republic of Macedonia, with reduction projections from 2010 to 2020, it should be pointed out that those have not been taken into account because of recalculations of the emissions made during the last years for this polluting substance. Therefore, revision of the projections for 2020 has been envisaged and those are not included in this report.

Also, the targets set under the older protocols (emissions in 1987 for NOx and emissions of NMVOCs for 1988) have not been exceeded in 2016, the year of reporting (according the rule n-2, where n is the current year).

These documents set the basis for achievement of the targets for reduction of emissions of ozone precursors thus resulting in reduced degradation of environment and negative effect on human health.


Reporting obligation
  • Reporting obligations under multilateral agreements – UNECE transboundary air pollution transfer, as well as to ЕЕА
  • Annual report of processed data on air emissions
General meta-data
Code Title of the indicator Compliance with CSI ЕЕА or other indicators Classification by DPSIR Type Linkage with area Frequency of publication
MK NI 002 Emissions of ozone precursors CSI 002 Emissions of ozone precursors П А
  • air
  • air quality
annually
Last modified: Friday November 11th, 2022