МК – NI 055


AVERAGE AGE OF ROAD MOTOR VEHICLES smile2 srelki d-eng
Definition

This indicator classifies road motor vehicles by motor vehicle type (passenger car, motor coaches and buses, commercial vehicles and trailers) and average age on country level.

Units
  • percentage (%).
Key policy question

Has the vehicle fleet resulted in decreased average age of vehicles?

Key message

Data for the reporting period on all vehicle categories indicates that vehicles aged above 10 years have the highest share in the overall number of vehicles.

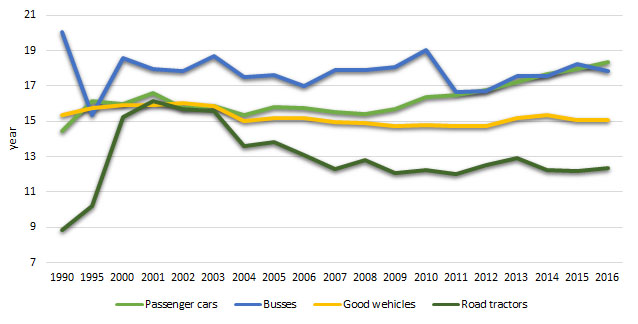
The average age of passenger cars has increasing trend ranging between 14.43 and18.36 years, buses have variable trend of decrease and increase ranging between 20 and 15.3 years. The average age of good wehicles has decreasing trend by 2011, followed by increase by 2016 and ranges between 16 and 14.71 years. For road tractors, the average age has significant decreasing trend in the period from 2001 to 2016, ranging at 16,12 and 12.01 years.

Figure 1. Share of passenger cars by average vehicle age in the overall number of passenger vehicles

CSI_Transport2018_055_g1EN


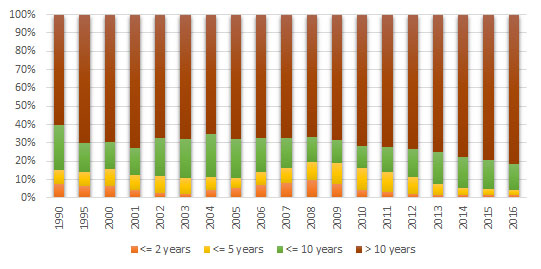
Figure 2. Share of motor coaches and buses by average vehicle age in the overall number of motor coaches and buses

CSI_Transport2018_055_g2EN

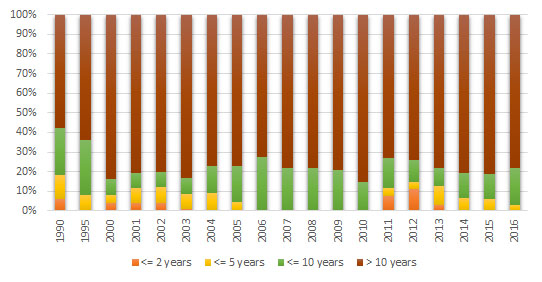
Figure 3. Share of trucks by average vehicle age in the overall number of trucks

CSI_Transport2018_055_g3EN

Figure 4. Share of trailers by average vehicle age in the overall number of trailers

CSI_Transport2018_055_g4EN

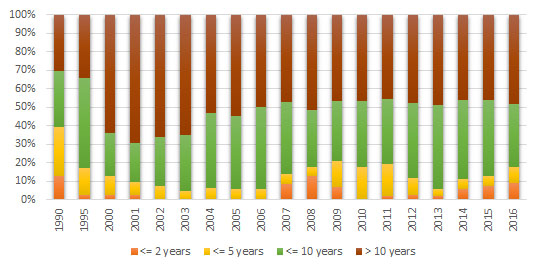
Figure 5. Average vehicle age

CSI_Transport2018_055_g5EN

Data coverage: excel

Data source:  State Statistical Office, Ministry of Interior

http://www.stat.gov.mk/Default_en.aspx, http://www.mvr.gov.mk

Assessment

Emissions of transport have great contribution to overall air emissions. Therefore, it is very important to renew vehicle fleet. Data for the reporting period on all vehicle categories indicates that the number of vehicles noted increase, but unfortunately vehicles aged above 10 years have the highest share in the overall number of vehicles which reflects old vehicle fleet with great influence of the total emissions of pollutants in the air.

The average age of passenger cars has increasing trend ranging between 14.43 and18.36years, buses have variable trend of decrease and increase ranging between 20 and 15.3 years. The average age of good wehicles had decreasing trend by 2011 followed with increase by 2016 and ranges between 16 and 14.71 years. For road tractors, the average age has significant decreasing trend in the period from 2001 to 2016 ranging between 16,12 and 12.01 years

With regard to passenger cars, the share in the overall number of vehicles in 2016, compared to 1990, aged above 10 years had increasing trend by 132.4%, vehicles aged from 5 to 10 years had decreasing trend by 3.51%, vehicles aged from 2 to 5 years were in decrease by 41.2% and vehicles aged up to 2 years had a trend of decrease by 61.1%.

The share in the overall number of buses in 2016 compared to 1990, of busesaged above 10 years had increasing trend by 31.6%, buses aged between 5 and 10 years had decreasing trend by 25%, busesaged between 2 and 5 years had variable trend ranging between 0% and 12.1% and vehicles aged up to 2 years had variable trend ranging between 0% and 11.1%.

With good wehicles during the reporting period, the share in the overall number ofgood wehicles aged above 10 years had increasing trend by65.4%, good wehicles aged between 5 and 10 years had increasing trend by100%, good wehicles aged between 2 and 5 years had increasing trend by36.8% and good wehicles aged up to 2 years had increasing trend by 70%.

The share in the overall number of road tractors in 2016 compared to 1990, of road tractors aged above 10 years had increasing trend of 3.86 time, road tractors aged between 5 and 10 years had variable trend and ranged between 21.4% and 48.6%, road tractorsaged between 2 and 5 years had decreasing trend by 16.67%and vehicles aged up to 2 years had variable trend ranging between 0% and13%.

Methodology
  • Methodology for the indicator calculation

Data for the indicator is obtained from the number of road motor vehicles by type and year of manufacturing, prepared by age groups and is calculated as share of the number of road motor vehicles by type. The sum of the shares (%) of all types of road motor vehicles by age groups should amount 100 (%), relative to total number of road motor vehicles by type of motor vehicles by age groups.

Policy relevance of the indicator

List of relevant policy documents

National Strategy for Transport prepared and adopted by the Government of the Republic of Macedonia determines the main directions of transport policy development in the Republic of Macedonia through identification of targets and strategy for development of road, railroad and air transport sector.

Legal grounds

  • Law on Road Transport (Official Gazette of RM no. 68/04, 127/06, 114/09, 83/10, 140/10, 17/11, 6/12, 23/13, 120/13, 163/13, 187/13, 42/14, 112/14, 166/14, 44/15, 97/15,124/15, 129/15, 193/15, 37/16and 71/16)
  • Law on Transport of Hazardous Matters in Road and Railroad Transport (Official Gazette of RM no. 92/07, 161/09, 17/11, 54/11, 13/13, 163/13, 38/14, 166/14, 116/15, 193/15and 31/16)
  • Law on State Statistics (Official Gazette of RM no. 54/97, 21/07 , 51/11 , 104/13, 42/14,192/15 and27/16)
  • Law on Road Transport Safety (Official Gazette of RM no. 169/15, 226/15, 55/16and11/18)
Target

The fourth target of the National Strategy for Transportis securing of sustainable protection of the environment.

Reporting obligation
  • EUROSTAT
General metadata
Code Title of the indicator Compliance with CSI/ЕЕА or other indicators Classification by DPSIR Тype Linkage with area Frequency of publication
MK NI 055 Average age of road motor vehicles TERM 033 Average age of the vehicle fleet D А Transport Monthly

Periodically

Annually

Last modified: Monday November 28th, 2022