


| PASSENGER TRANSPORT DEMAND |
The indicator “passenger transport demand” will be presented in two different ways:
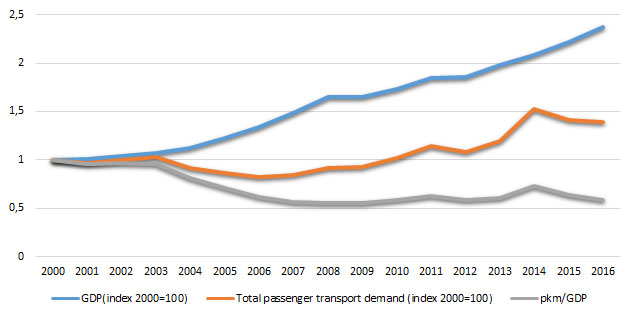
1) To measure decoupling of passenger transport demand from economic growth, the volume of passenger transport relative to GDP will be used. The decoupling indicator is defined as the ratio between pkm (inland modes) and GDP (Gross Domestic Product in constant 2000 EUR). In the presentation of this indicator in the Republic of Macedonia, the index 2000=100 is taken as baseline year.
2) Share of passenger transport: This indicator is defined as the percentage share of each mode of transport in the total inland transport. The unit used is the passenger-kilometre (pkm), which represents one passenger traveling a distance of one kilometre. It is based on transport by passenger cars, buses and coaches and trains.
All data should be based on movements on national territory, regardless of the nationality of the vehicle. However, data collection methodology should be harmonised at the EU level.
The unit used is the passenger-kilometre (pkm), which represents one passenger travelling a distance of one kilometre. It is based on transport by passenger cars, buses and coaches, and trains.
Passenger transport demand and GDP are shown as an index 2000=100.
Is the passenger transport in road transport reduced compared to other transport modes?
Is the passenger transport demand decoupled from economic growth?
The overall passenger transport demand has grown by 38.43% during the analyzed period.
The share of road transport in the total passenger transport was 99.1% in 2016, reflecting an increase by 44.82 % compared to 1990, for railroad transport it was 0.9% in 2016 or decline by 4.28 times relative to 1990.
The share of the private cars in the total passenger transport is the highest. The share in 2016 was 77.7%, being at the same time the highest share during the analyzed period. Increased demand for cars has direct reflection on the structure of passenger inland transport, negative impacts on environment and health, especially for the fact that high number of vehicles transports low number of passengers. Data on the share of private vehicles and public road transport in cities has been estimated.
Demand for passenger transport per capita was the lowest in 2006 – 2690 km, and the highest in 2015 with 4558 km.
Figure 1 Passenger kilometers of individual modes of passenger transport in the total passenger transport
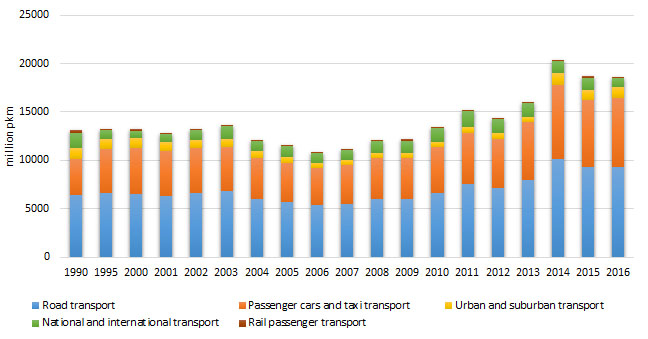
Figure 2 Share of individual modes of passenger transport in the total passenger transport
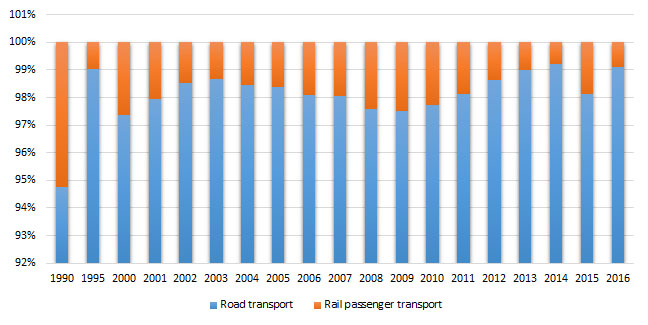
Figure 3: Demand for passenger transport per capita
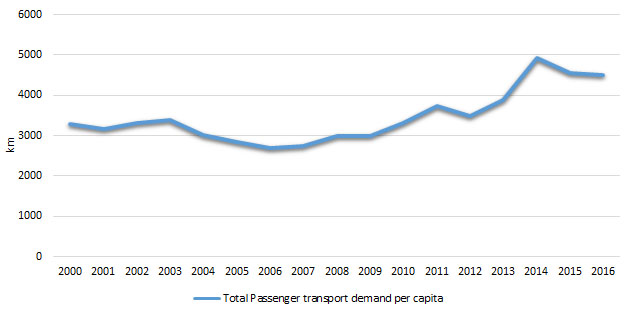
Figure 4: Total passenger transport demand/GDP ratio
Data coverage: excel
Data source: State Statistical Office, http://www.stat.gov.mk/Default_en.aspx
The total passenger transport demand during the analyzed period ranged between 5492 and9441passenger kilometers, noting increase by 38.43%.The share of road transport in the total passenger transport was 99.1% in 2016reflecting increase by 44.82% compared to 1990, and it was 0.9% in railroad transport in 2016or decrease by 4.28 timescompared to 1990.
The share of passenger cars and taxi transport in the total passenger transportwas the highest. In 2016, it had share of 77.7% representing also the highest share during the analyzed period. The lowest share of 57.7% was recorded in 1990. In the period from 2000 to 2006, there was a falling trend by 25.9%, followed by growing trend up to 2016by70.1%. This indicates that the reduction of environmental pollution requires reduction in the share of road transport in the share of passenger transport in favour of other transport modes. This would also result in avoided costs for the expensive liquid fuel which while combusting pollutes the environment.
The urban and suburbantransport in cities throughout the analyzed period noted trend of reduction amounting 9.08%.
National and international transport during the analyzed period noted variable trend with the biggest reduction in 2016 of 4.28 times compared to 1990recorded for railway transport meaning that this transport mode was used at very low rate.
Data on the share of passenger cars and taxi transport in cities was estimated and data on the share of urban and suburban transport in cities was estimated in the period from 1990to 2013.
The passenger transport demand per capita was the lowest in 2006 with 2690kmper capita, and the highest in 2015with 4558kmper capita.
The trend of the passenger kilometer/GDP ratio from 2000to 2016 was mainly in decrease. It is indexed for the year 2000=100 in order to monitor the changes in the intensity of passenger transport demand relative to economic growth presented through GDP.
- Methodology for the indicator calculation
In order to measure the decoupling of passenger transport demand from economic growth, the volume (i.e. intensity) of passenger transport relative to GDP is calculated. Relative decoupling occurs when the passenger transport demand rises at rate lower than the one of the GDP. Absolute decoupling occurs when the passenger transport demand falls while GDP rises or remains constant.
The unit used is passenger-kilometre (pkm), which represents one passenger traveling a distance of one kilometre.
With regard to EU Member States, according to Regulation on road transport and Regulation (EC) No 91/2003 on railroad transport statistics, data is based on all movements of passenger transport on the national territory.
Source of used methodology
Structural indicators of Eurostat on transport
State Statistical Office
- Methodological uncertainty and data uncertainty
All data is based on the movements on the national territory, regardless of the nationality of the vehicle. The methodology of data collection has been harmonised at EU level, but estimated data has been used for the purposes of data calculation on the transport by passenger car. Sources include EUROSTAT, National statistical offices, ECMT, UNECE, UIC, DG TREN.
In order to answer the question whether the passenger transport demand is decoupling from economic growth, the intensity of passenger transport relative to changes in real GDP is considered.
- Uncertainty of data sets
In order to obtain full picture of passenger transport demand and corresponding problems in the environment, it would be very useful to supplement data with data on the number of vehicle-kilometers.
List of relevant policy documents
The National Strategy for Transport prepared and adopted by the Government of the Republic of Macedonia determines the main directions of the transport policy development in the Republic of Macedonia through identification of goals and development strategy for road, rail and air transport sectors.
Legal grounds
The road transport is regulated by the Law on Road Transport. It regulates the conditions and the manner of performing transport of passengers and goods in internal and international road transport.
Transportation of dangerous goods is regulated by the Law on Dangerous Goods Transportation in Road and Railroad Transport, regulating the conditions under which transport of dangerous goods shall be performed (preparation of matter, loading, transport, on road procedures, unloading, safety in transportation, vehicles equipment and staff training).
Railroad transportation is regulated by the Law on Railroads, Law on Agreements on Transportation in Railroad Traffic, Law on Agency Regulating Railroad Transport Services Market and Law on Railroad Transport Safety.
- EUROSTAT
| Code | Title of the indicator | Compliance with CSI/ЕЕА or other indicators | Classification by DPSIR | Тype | Linkage with area | Frequency of publication | |
| MK NI 035 | Passenger transport demand | CSI 035 | Passenger
transport demand
|
P | B |
|
Monthly
Periodically Annualy |