MK – NI 063


EMMISSION OF HEAVY METALS – NICKEL (Ni) smajli 1 arrows p2
Definition

The indicator tracks the trends innickel (Ni).

Units

t (tons per year)

Key policy issue

What progress has been made in overall reduction of emissions of nickel in the Republic of Macedonia?

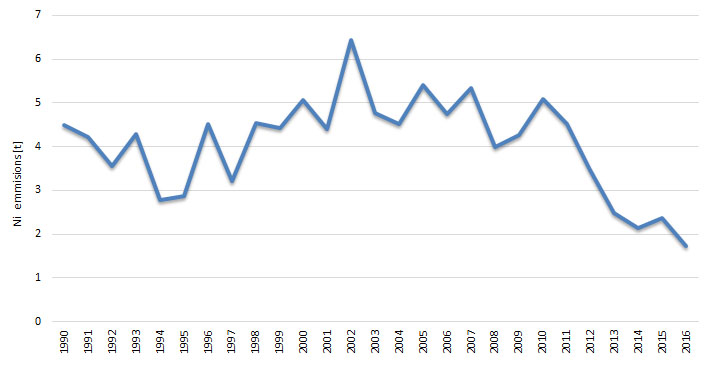
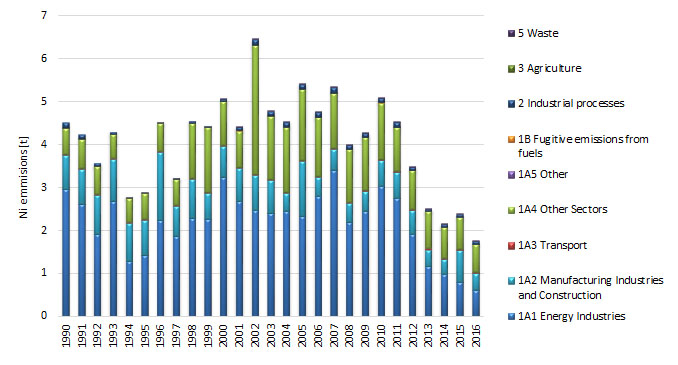
In 1990, the overall national emissions of Ni amounted to 4.5 t, with emissions manifesting variable trend with a jump in 2002, followed again by variable trend and continuous reduction since 2010 (small exception is 2015 where there is a slight increase in emissions compared to 2014). Emissions in 2016 were reduced by 61% compared to 1990, and 27% compared to 2015.

The Diagram below shows annual trend in nickel (Ni) emissions for the period 1990 to 2016.


Diagram 1.Trend in emissions of nickel (Ni)

CSI_vozduh2018_063_Ni_g1EN

Assessment

Under the CARDS Programme, Inventory of air emissions of the main pollutants in the country was established in 2005 in accordance with the EMEP methodology by individual sectors, i.e. activities, and in 2014 Inventory including all pollutants was prepared.

Sectors based on the above mentioned methodology and SNAP – selective nomenclature of air pollution are presented in the table below:

 Sector
Energy Production and distribution
Commercial, instiucional and households
Industry (combustion)
Industry (production)
Fugitive emissions
Use of solvents and products
Road transport
Non-Road transport
Waste
Agriculture
Other

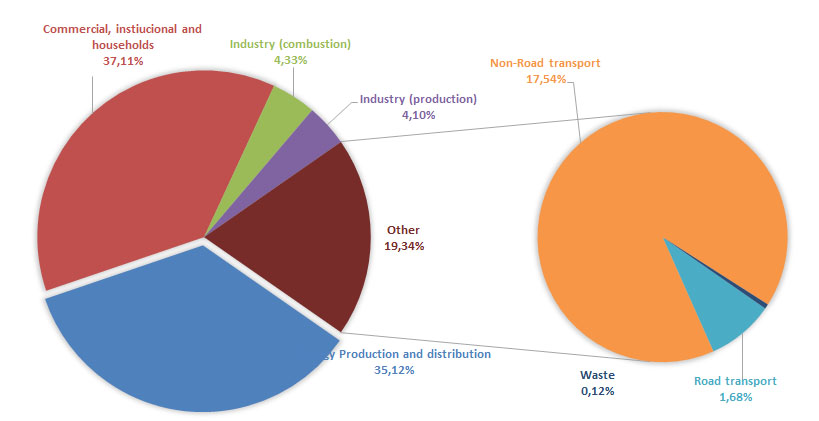
The most important sources of Ni emissions in 2016 represent sectors Commercial, institutional and households and Energy production and distribution with shares of 37.1% and 35.1%, respectively, followed by the sector Non-Road transport with a share of 17.5%. Sectors Industry (Combustion) and Industry (production) account with share of 4.3% and 4.1%, respectively, in the total emissions of nickel.

Diagram 2. Emissions ofnickel (Ni) bysectors in 2016

CSI_vozduh2018_063_Ni_g2EN

Policy specific issue

Which different sectors and processes contribute to emissions of nickel (Ni)?

Main sources of Ni emissions in the period 1990 – 2016 are NFR categories 1A1 – Energy industries, 1A2 -Combustion in manufacturing and construction and 1A4 – Other sectors with share in total emissions of nickel in 2016 of 35% (65% in 1990), 22% (18% in 1990) and 37% (14% in 1990) respectively. In terms of 2015, the emissions from the above NFR categories registered in 2016 are decreased by 23%, 49% and 12% respectively.

Diagram 3. Emissions of nickel (Ni) by NFR categories per year

CSI_vozduh2018_063_Ni_g3ENData coverage: excel_1, excel_2

Sources of data: The data used refers to overall national emissions and emissions categorized by NFR delivered by EEA member and collaborating states to EEA and Secretariat of the United Nations. Data is accessible per country on the following web address:http://cdr.eionet.europa.eu/mk/un/clrtap/inventories/envwovm7g/.

Methodology
  • Methodology for indicator calculation

The methodology for this indicator calculation is based on calculated national emissions and emissions by NFR categories of this pollutant Ni reported to EEA (European Environmental Agency) and UNECE/EMEP (United Nations Economic Commission for Europe/Cooperative programme for monitoring and evaluation for transboundary air pollution transfer under the Convention on Transboundary Air Pollution Transfer) in February 2016. Data used in this report is in accordance with the data submitted, the difference being that additional allocation of national emissions has been made apart from NFR (as sent to international organizations) also by sectors.

Reference of used methodology

Methodology used for calculation and presentation of this indicator is given in EMEP/EEA Guidebook for inventory of air pollutant emissions of 2009, Guidebook of 2013 and Guidebook of 2016 which may be accessed at the following links http://www.eea.europa.eu/publications/emep-eea-emission-inventory-guidebook-2009, http://www.eea.europa.eu/publications/emep-eea-emission-inventory-guidebook-2013and http://www.eea.europa.eu/publications/emep-eea-guidebook-2016).

Policy relevance of the indicator

Action Plan for European Partnership, as well as National Plan for approximation of the national legislation with European regulations specifying bylaws that need to be prepared have been adopted.

The National Environmental Action Plan (NEAP II) was adopted. It contains the measures that need to be taken to improve the overall status of air quality, including the reduction of emissions of acidifying substances. The National Plan for Ambient Air Protection for the period 2012 to 2017 specifying the measures for air protection on national level and the National Programme for gradual air emissions reduction by 2020 have been adopted in order to define and implement measures on national level.

At the same time, for the purpose of air quality improvement in certain local self-government units (LSGUs) with action plans, program was prepared for the City of Bitola. Air quality plans and short term action plans for city of Skopje and city of Tetovo are prepared in the Twining project “Further strengthening the capacities for effective implementation of the acquis in the field of air quality”, which were adopted by the councils of the municipalities. Additionally the municipality of Veles also has prepared and adopted air quality plan in November 2017.

Targets

Does any of the national documents set target or target should be achieved in accordance with other international documents?

National strategic documents listed as references in the above text provide guidelines and specify actions that should be undertaken as a matter of priority. It is important to mention thatbylaws have been prepared in the area of air emissions transposing Directives 96/61/EC, 2000/81/EC, 2000/76/EC, 99/13/EC and 2001/81/EC, ranging between 90 and 100%.

In accordance with the requirements of the UNECE Convention on Long-Range Transboundary Air Pollution, inventory based on EMEP/EEA Guidebook for inventory of polluting substances into the air, setting the target of regular inventory of pollutants in tons per year following the n-2 principle, where n is the current year.

Legal basis

The Law on Ambient Air Quality adopted in August 2004 and amended several times afterwards (Official Gazette of RM no. 67/2004, 92/2007, 83/2009, 35/10, 47/11, 100/12, 163/2013,10/2015 и 146/2015) is framework law in the area of air. The goals of this Law include avoiding, prevention and reduction of harmful effects on human health and environment as a whole, prevention and abatement of pollutions cadmiuming to climate change, as well as provision of appropriate information on the quality of ambient air.

On the basis of the Law on Ambient Air Quality, 16 bylaws were prepared and adopted to introduce limit values for air quality and air emissions, methodology of air quality and air emissions monitoring, manner of preparation of planning documents for air protection against pollution, manner of informing the citizens and international organizations, etc.

In relation to this polluting substance, the limit values and thresholds for assessment in accordance with the Framework Air Directive 2004/107/EC are prescribed in the following bylaws: Decree on the limit values for the levels and types of polluting substances in the ambient air and alert thresholds, deadlines for limit values achievement, margines of tolerance for the limit value, target value ands and long-term objectives and Rulebook on criteria, methods and procedures for ambient air quality assessment.

Reporting obligation
  • Reporting obligations towards international agreements – UNECE-CLRTAP and ЕЕА
  • Annual Report of Processed Data on Air Emissions
General metadata
Code Title of the indicator Compliance with CSI ЕЕА or other indicators Classification by DPSIR Type Linkage with area Frequency of publication
MK NI 063 Emissions of heavy metals – nickel (Ni) P A
  • air
  • quality of air
annually
Last modified: Tuesday November 15th, 2022