MK – NI 061


EMMISSION OF PARTICULATE MATTER – TOTAL SUSPENDED PARTICLES (TSP) smile1 arrows p2
Definition

The indicator tracks the trends intotal suspended particles (TSP).

Units

kt (kilotons per year)

Key policy issue

What progress has been made in overall reduction of emissions of total suspended particles in the Republic of Macedonia?

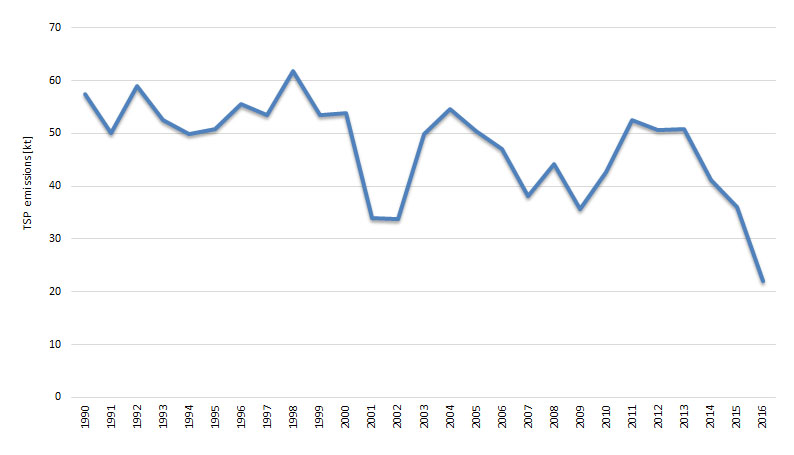
In 1990 total national emissions of TSP were 57.4 kt. By comparison, in 2016 emissions are reduced by 62% and amount to 22 kt. A big difference in TSP emissions is in 2016 in relation to 2015 where the reduction is 39%. The main reason for this decrease (2016 in relation to 2015) was due to lower emissions from industrial processes (ferroalloy production), 54%, and from energy production 64%.

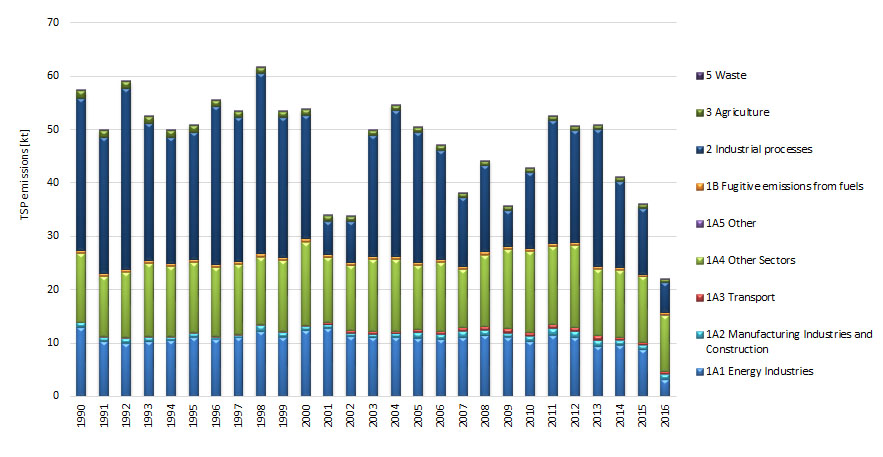
The Diagram below shows annual trend in the emissions of total suspended particles (TSP) for the period 1990 to 2016.

Diagram 1.Trend in emissions of total suspended particles (TSP)

CSI_Vozduh2018_061_TSP_g1EN

Assessment

Under the CARDS Programme, Inventory of air emissions of the main pollutants in the country was established in 2005 in accordance with the EMEP methodology by individual sectors, i.e. activities, and in 2014 Inventory including all pollutants was prepared.Starting from 2014, the Republic of Macedonia carries out calculations of national emissions for all pollutants.

The emission sources, within this national indicator, are made according to the following categorization:

 Sector
Energy Production and distribution
Commercial, instiucional and households
Industry (combustion)
Industry (production)
Fugitive emissions
Use of solvents and products
Road transport
Non-Road transport
Waste
Agriculture
Other

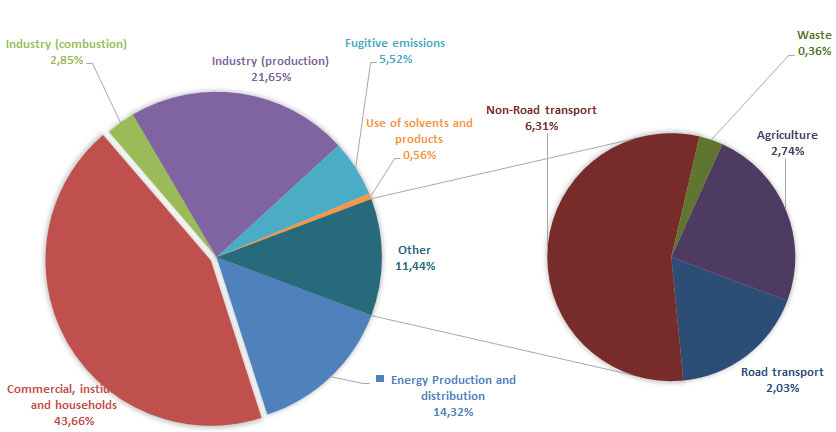
The main sources of emissions of TSP in 2016 are sectors 2 – Commercial, Institutional and household, 4 –Industry (production) (mainly 2C2 Ferroalloy production) and 1 – Energy production and distribution with shares of 43,7%, 21,7% and 14,3%, respectively.

Diagram 2. Emissions oftotal suspended particles (TSP) by SNAP sectors per year in 2016

CSI_Vozduh2018_061_TSP_g2EN


Policy specific issue

Which different sectors and processes contribute to TSP emissions?

Main sources of TSP emissions in 2016 are the NFR categories 1A4 – Other sectors (primarily household heating), 2 – Industrial processes (mainly 2C2 Ferroalloy production) and 1A1 Energy industries with shares of 48%, 26% and 14%, respectively, in the total emissions of TSP.

NFR sectors of categories 1B – Fugitive emissions from fuels, 3 – Agriculture and 5 – Waste are insignificant sources of emissions of TSP.

For the years 2001, 2002 and 2009, emissions are very low, compared to other years. The reasons for this are that emissions from the production of ferroalloys are very low due to the fact that in these years the ferrosilicon production company has worked with limited capacity and the quantities of ferrosilicon produced are 80-90% lower compared to the production in 2014.

From 2013 to 2014, emissions again decreased by 23%, due to lower emissions from ferroalloy production, as well as reduced household heating emissions. A significant reduction in emissions in 2016 compared to 2015 occurs mainly due to the large reduction of TSP emissions from NFR categories 2 – Industrial processes (mainly 2C2 Ferroalloys production), due to the reduced capacity in the operation of the ferrosilicon production plant, and 1A1 – Energy industries.


Diagram 3. Emissions of total suspended particles (TSP) by NFR sectors per year

CSI_Vozduh2018_061_TSP_g3ENData coverage: excel_1, excel_2

Sources of data: The data used refers to overall national emissions and emissions categorized by NFR delivered by EEA member and collaborating states to EEA and Secretariat of the United Nations. Data is accessible per country on the following web address:http://cdr.eionet.europa.eu/mk/un/clrtap/inventories/envwovm7g/.

Methodology
  • Methodology for indicator calculation

The methodology for this indicator calculation is based on calculated national emissions and emissions by NFR categories of this pollutant as reported to EEA (European Environmental Agency) and UNECE/EMEP (United Nations Economic Commission for Europe/Cooperative programme for monitoring and evaluation for transboundary air pollution transfer under the Convention on Transboundary Air Pollution Transfer) in February 2016. Data used in this report is in accordance with the data submitted, the difference being that additional allocation of national emissions has been made apart from NFR (as sent to international organizations) also by sectors.

Calculations are in line with the Guidebook of EMEP/EEA on air emissions inventory taking published in 2009, Guidebook of 2013 and Guidebook of 2016. The Guidebook contains emission factors which have been used in the calculations, except for the energy sector where calculations were made by use of country specific factors or use of data from the measurements completed in the period 2008-2016 for this polluting substance for the NFR category 1A1a concerning electricity and heat producing plants.

Reference of used methodology

Methodology used for calculation and presentation of this indicator is given in EMEP/EEA Guidebook for inventory of air pollutant emissions of 2009, Guidebook of 2013 and Guidebook of 2016 which may be accessed at the following links (http://www.eea.europa.eu/publications/emep-eea-emission-inventory-guidebook-2009, http://www.eea.europa.eu/publications/emep-eea-emission-inventory-guidebook-2013 and http://www.eea.europa.eu/publications/emep-eea-guidebook-2016).

Policy relevance of the indicator

Action Plan for European Partnership, as well as National Plan for approximation of the national legislation with European regulations specifying bylaws that need to be prepared have been adopted.

The National Environmental Action Plan (NEAP II) was adopted. It contains the measures that need to be taken to improve the overall status of air quality, including the reduction of emissions of acidifying substances. The National Plan for Ambient Air Protection for the period 2012 to 2017 specifying the measures for air protection on national level and the National Programme for gradual air emissions reduction by 2020 have been adopted in order to define and implement measures on national level.

At the same time, for the purpose of air quality improvement in certain local self-government units (LSGUs) with action plans, program was prepared for the City of Bitola,. Air quality plans and short term action plans for city of Skopje and city of Tetovo are prepared in the Twining project “Further strengthening the capacities for effective implementation of the acquis in the field of air quality”, which were adopted by the councils of the municipalitieswhich should be finalized at the end of 2016. Additionally, the municipality of Veles also has prepared and adopted air quality plan in November 2017. National plan for reduction pollution for sulphur dioxide (SO2), nitrogen oxides (NOx) and dust (TSP) for existing Large Combustion Plant (LCP) has been prepared. The plan was approved by the Energy Community and the revised plan was adopted by the Government of the Republic of Macedonia in December 2017.

Targets

Does any of the national documents set target or target should be achieved in accordance with other international documents?

National strategic documents listed as references in the above text provide guidelines and specify actions that should be undertaken as a matter of priority. It is important to mention thatbylaws have been prepared in the area of air emissions transposing Directives 96/61/EC, 2000/81/EC, 2000/76/EC, 99/13/EC and 2001/81/EC, ranging between 90 and 100%.

In accordance with the requirements of the UNECE Convention on Long-Range Transboundary Air Pollution, inventory based on EMEP/EEA Guidebook for inventory of polluting substances into the air, setting the target of regular inventory of pollutants in tons per year following the n-2 principle, where n is the current year. With regard to this polluting substance, air emission limit values are set in the bylaw compliant with the following Directives: 2001/80/ЕC, 1999/13/EC and 2000/76/EC.

As already mentioned, a National Emission Reduction Plan (NERP) has been adopted.

REK Bitola is already undertaking activities for finding funds to start the desulfurization process, which would also reduce the TSP emissions.

Legal basis

The Law on Ambient Air Quality adopted in August 2004 and amended several times afterwards (Official Gazette of RM no. 67/2004, 92/2007, 83/2009, 35/10, 47/11, 100/12, 163/2013,10/2015 и 146/2015) is framework law in the area of air. The goals of this Law include avoiding, prevention and reduction of harmful effects on human health and environment as a whole, prevention and abatement of pollutions leading to climate change, as well as provision of appropriate information on the quality of ambient air.

On the basis of the Law on Ambient Air Quality, 16 bylaws were prepared and adopted to introduce limit values for air quality and air emissions, methodology of air quality and air emissions monitoring, manner of preparation of planning documents for air protection against pollution, manner of informing the citizens and international organizations, etc. The most relevant bylaw for this polluting substance is the Rulebook on the limit values for permissible levels of emission and types of polluting substances in waste gases and steams released from stationary sources in the air, which sets the limit values of air emissions from different technological processes.


Reporting obligation
  • Reporting obligations towards international agreements – UNECE-CLRTAP and ЕЕА
  • Annual Report of Processed Data on Air Emissions
General metadata
Code Title of the indicator Compliance with CSI ЕЕА or other indicators Classification by DPSIR Type Linkage with area Frequency of publication
MK NI 061 Emissions of particulate matter – total suspended particles (TSP) UNECE A1/12 P A
  • air
  • quality of air
annually
Last modified: Tuesday November 15th, 2022