Environmental indicators


 rdf / xml xmlicon

ENVIRONMENTAL INDICATORS GENERAL

Environmental reporting through indicators is an ambitious venture – to produce a report, a reflection of the state of the environment presented by as many as possible quantitative and qualitative data obtained through scientifically based measurements and analysis that indicate sources, causes, consequences and trends of specific conditions. Preparation of indicators is fulfillment of one of the obligations under the Law on Environment and establishes the grounds necessary for proper decision making in the process of environmental management. This ensures the expected contribution to the sustainable development of our country.

By way of selected indicators on individual media and areas of the environment, we have tried to present the state of the environment, the trends and the progress in individual areas to vocational and general public by providing accurate and validated data.

Information on the state of the environment is always interesting and popular. It is vital in policy and important decisions making and every citizen of the Republic of Macedonia is entitled to know it in order to be able to contribute to the process of the state improvement.

Contact: Katerina Nikolovska, k.nikolovska@moepp.gov.mk

WHY ENVIRONMENTAL INDICATORS?

The establishment and development of environmental indicators was driven by the need to identify indicators of relevance for the environmental state monitoring and policy creation, in line with the EEA Core Set of Indicators (CSI);it was approved by all relevant bodies and the set reached 37 indicators was adopted in 2004.These indicators should answer the key questions related to the development of environmental policy.

Properly selected indicators based on adequately selected time series show the key trends and enable fast and appropriate acting of all stakeholders in the process of environment protection, being especially relevant for environmental policy making.

In 2008, the Government of the Republic of Macedonia adopted the Environmental Indicators of the Republic of Macedonia prepared by the Macedonian Environmental Information Centre. In this way, indicators specific on national level were identified. 40 indicators in 12 chapters were adopted.

Indicator development is a dynamic process subject to continuous updating and upgrading and thus this basic list of 40 indicators is updated and upgraded.

CLASSIFICATION OF ENVIRONMENTAL INDICATORS

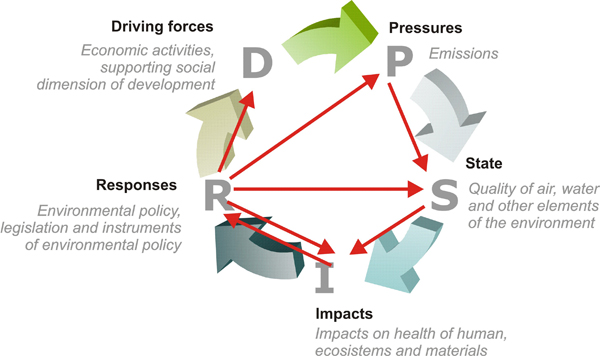
All indicators in a set have been classified in accordance with the framework known by its abbreviation DPSIR, comprising the following concepts: Driving forces – Pressures – State – Impacts – Responses, where each phase transmits its own meaning (Figure 1). This framework is particularly important and clear with regard to environmental policy creation.

  • Driving forces are a social and economic factors and activities that cause either the increase or mitigation of pressures on the environment. They may, for example, include the scope of economic, transport or tourist operations.
  • Pressures are represented by direct anthropogenic pressures and impacts on the environment, such as pollutant emissions or the consumption of natural resources.
  • State relates to the current state and trends of the environment that determine the level of air, water body and soil pollution, the biodiversity of species within individual geographical regions, the availability of natural resources, such as timber and fresh water.
  • Impacts are the effects that the environmental changes have on human and non-human health status.
  • Responses are society’s reactions to environmental issues. They may include specific State measures, such as taxes on the consumption of natural resources. Decisions made by companies and individuals, such as corporate investments into pollution control or purchase of recycled goods by households are also important.

Strelki indikatori voved EN

Indicators are also classified by their type into five categories, namely:

А = descriptive indicator (answering the question What is happening to theenvironment and to humans?; in other words, it describes the current state )

B = performance indicator (answering the question What is the distance between the currentenvironmental situation and the desired situation (target)?, or it compares the current state of the environment with the specified environmental protection targets and they serve the monitoring of the progress towards such targets).

C = efficiency indicator (answering the question Does the environment improve?, or it states if the socity has improved the quality of products and processes relative to resources, emissions and waste per unit waste)

D = Policy-effectiveness indicator (answering the question How effectively has the official country’s environmental policy been implemented? Or if and to what extent the official national policy has been implemented)

E = Total Welfare indicators (answering the question Has the overall state improved?, or it describes if and to what extent has the country practiced sustainable development, i.e. economic development providing social welfare for the citizens and protection for the environment).

PRESENTATION OF ENVIRONMENTAL INDICATORS

In order to present indicators in a comprehensive manner, their information and data are presented by brief description of the indicator, prepared in accordance with the template established by the European Environmental Agency in the following order:

Slika za voved со текст EN

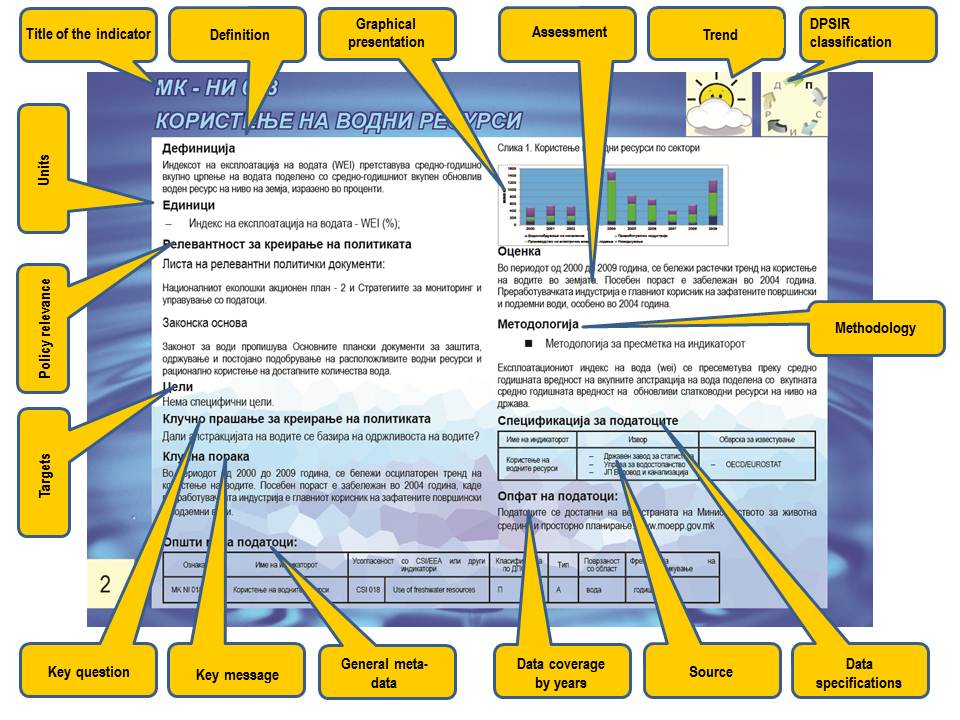
Quantitative values of a given indicator are expressed mostly as annual values for a given period, and presented by means of diagrams, tables and maps. They are then followed by explanations interpreting the trend and the possible causes, as well as the measures undertaken and planned to improve or preserve the current status of the environment. Each indicator is accompanied by a symbol making assessment of individual indicators and showing the trend of presented data and specified targets.

Symbols indicating trends assessment
smile Positive development indicating the achievement of a qualitatively or quantitatively defined target
smile1 Undefined course of development, insufficient for achieving qualitative or quantitative targets; it may also be a changeable trend within a given indicator
smile2 Unfavourable course of development
Topics DPSIR Code Title of the indicator Trend
AIR POLLUTION Pressures МК NI 001 EMISSIONS OF ACIDIFYING SUBSTANCES smile1
AIR POLLUTION Pressures МК NI 002 EMISSIONS OF OZONE PRECURSORS cloud2
AIR POLLUTION State МК NI 004 EXCEEDANCE OF AIR QUALITY LIMIT VALUES IN URBAN AREAS – By monitoring station cloud2
AIR POLLUTION  State Sulphur dioxide (SO2) smile1
AIR POLLUTION  State Nitrogen dioxide (NO2) smile1
AIR POLLUTION  State Particulate matter of a size up to 10 micrometer (PM10) cloud2
AIR POLLUTION  State Ozone (O3) smile1
AIR POLLUTION  Pressures MK NI 050 EMMISSION OF THE MAIN POLLUTING SUBSTANCES – EMISSION OF AMMONIA (NH3) smile
AIR POLLUTION  Pressures EMMISSION OF THE MAIN POLLUTING SUBSTANCES – EMISSION OF SULPHUR OXIDES (SOx) smile1
AIR POLLUTION Pressures EMMISSION OF THE MAIN POLLUTING SUBSTANCES – EMISSION OF NITROGEN OXIDES EXPRESSED AS NITROGEN DIOXIDE (NOx) smile1
AIR POLLUTION  Pressures EMMISSION OF THE MAIN POLLUTING SUBSTANCES – EMISSION OF NON-METHANE VOLATILE ORGANIC COMPOUNDS (NMVOC) smile1
AIR POLLUTION  Pressures EMMISSION OF THE MAIN POLLUTING SUBSTANCES – CARBON MONOXIDE (CO) smile1
AIR POLLUTION Pressures MK NI 061 EMMISSION OF PARTICULATE MATTER – TOTAL SUSPENDED PARTICLES (TSP) smile1
AIR POLLUTION Pressures EMMISSION OF PARTICULATE MATTER – PARTICULATE MATTER (PM10) HAVING DIAMETER OF 10 MICROMETERS OR LESS smile1
AIR POLLUTION Pressures EMMISSION OF PARTICULATE MATTER – PARTICULATE MATTER (PM2.5) HAVING DIAMETER OF 2.5 MICROMETERS OR LESS smile1
AIR POLLUTION Pressures MK NI 062 EMMISSION OF PERSISTENT ORGANIC POLLUTANTS – Polycyclic aromatic hydrocarbons (PAHs) smile1
AIR POLLUTION Pressures EMMISSION OF PERSISTENT ORGANIC POLLUTANTS – Polychlorinated biphenyls (PCBs) smile
AIR POLLUTION Pressures EMMISSION OF PERSISTENT ORGANIC POLLUTANTS – Dioxins and furans (PCDD/PCDF) smile1
AIR POLLUTION Pressures MK NI 063 EMMISSION OF HEAVY METALS – LEAD (Pb) smile
AIR POLLUTION Pressures EMMISSION OF HEAVY METALS – CADMIUM (Cd) smile
AIR POLLUTION Pressures EMMISSION OF HEAVY METALS – MERCURY (Hg) smile
AIR POLLUTION Pressures EMMISSION OF HEAVY METALS – ARSENIC (As) smile1
AIR POLLUTION Pressures EMMISSION OF HEAVY METALS – NICKEL (Ni) smile
BIODIVERSITY State

Impacts

МК NI 007 THREATENED AND PROTECTED SPECIES cloud2
BIODIVERSITY Responses МК NI 008 DESIGNATED AREAS smajli1
BIODIVERSITY State МК NI 009 SPECIES DIVERSITY cloud2
BIODIVERSITY State МK NI 052 FORESTS AND OTHER WOODED LAND smile1
CLIMATE CHANGE Pressures МК NI 010 GREENHOUSE GAS EMISSIONS smile1
CLIMATE CHANGE Pressures МК NI 011 PROJECTIONS OF GREENHOUSE GAS EMISSIONS cloud2
CLIMATE CHANGE Pressures МК NI 006 CONSUMPTION OF OZONE DEPELTING SUBSTANCES smile
CLIMATE CHANGE Pressures МК NI 012 AIR TEMPERATURE smile1
CLIMATE CHANGE Pressures МК NI 051 ATMOSPHERIC PRECIPITATIONS smile1
SOIL Pressures МК NI 014 LAND TAKE smile1
SOIL Responses МК NI 015 PROGRESS IN MANAGEMENT OF CONTAMINATED SITES smile1
SOIL Impacts МК NI 038 FOREST FIRES cloud2
SOIL Impacts МК NI 053 SOIL EROSION cloud2
WASTE Pressures МК NI 016 MUNICIPAL WASTE GENERATION cloud2
WASTE Pressures МК NI 056 MANAGEMENT OF HAZARDOUS WASTE cloud2
WASTE Impacts МК NI 057 FINAL MUNICIPAL WASTE MANAGEMENT cloud2
WASTE Pressures МК NI 064 QUANTITY OF GENERATED WASTE BATTERIES AND ACCUMULATORS smile
WASTE Pressures МК NI 065 QUANTITY OF GENERATED PACKAGING WASTE smile1
WASTE Pressures МК NI 066 QUANTITY OF GENERATED MEDICAL WASTE smile
WATER Pressures МК NI 018 USE OF FRESHWATER RESOURCES smile1
WATER State МК NI 019 OXYGEN CONSUMING SUBSTANCES IN RIVERS smile1
WATER State МК NI 020 NUTRIENTS IN FRESHWATER smile1
WATER State МК NI 022 BATHING WATER QUALITY smile1
WATER Responses МК NI 024 URBAN WASTE WATER TREATMENT smile
WATER State МК NI 039 DRINKING WATER QUALITY smile1
WATER Driving forces МК NI 040 IRRIGATED LAND smile1
AGRICULTURE Pressures МК NI 025 GROSS NUTRIENT BALANCE smile1
AGRICULTURE Responses МК NI 026 AREA UNDER ORGANIC FARMING smile1
AGRICULTURE Driving forces МК NI 08 MINERAL FERTILISER CONSUMPTION smile
AGRICULTURE Driving forces МК NI 09 CONSUMPTION OF PESTICIDES smile1
ENERGY Driving forces МК NI 027 FINAL ENERGY CONSUMPTION BY SECTOR smile1
ENERGY Responses МК NI 028 TOTAL ENERGY INTENSITY cloud2
ENERGY Driving forces МК NI 029 TOTAL ENERGY CONSUMPTION BY FUEL cloud2
ENERGY Responses МК NI 030 RENEWABLE ENERGY CONSUMPTION smile1
ENERGY Responses МК NI 031 RENEWABLE ELECTRICITY smile1
ENERGY Driving forces МК NI 058 ENERGY DEPENDENCE FOR ALL FUELS cloud2
ENERGY Driving forces МК NI 059 TOTAL ENERGY CONSUMPTION PER CAPITA smile1
ENERGY Driving forces МК NI 060 SHARE OF RENEWABLE ENERGY IN GROSS FINAL ENERGY CONSUMPTION smile1
FISHERY State МК NI 041 FISH STOCK CHARACTERISTICS smile1
TRANSPORT Driving forces МК NI 035 PASSENGER TRANSPORT DEMAND cloud2
TRANSPORT Driving forces МК NI 036 FREIGHT TRANSPORT DEMAND cloud2
TRANSPORT Driving forces МК NI 054 ROAD MOTOR VEHICLES BY FUEL TYPE cloud2
TRANSPORT Driving forces МК NI 055 AVERAGE AGE OF ROAD MOTOR VEHICLES cloud2
HEALTH State  МК NI 046 MORTALITY FROM TRAFFIC ACCIDSENTS WITH CHILDREN AND YOUNG PEOPLE smile1
TOURISM Pressures

Driving forces

МК NI 047 TOURIST TRURB-OVER IN THE REPUBLIC OF MACEDONIA
1 International tourist visits smajli1
2 Foreign tourists stay smajli1
3 Domestic tourist visits smajli1
TOURISM Impacts МК NI 048 TOURISM SCALE AND FACILITIES INTENSITY smile1
TOURISM Driving forces МК NI 049 ROLE OF TOURISM IN ECONOMY cloud2
ENVIRONMENTAL PROTECTION EXPENDITURES Responses МК NI 067 ENVIRONMENTAL PROTECTION EXPENDITURES smile1