| FINAL ENERGY CONSUMPTION BY SECTOR |
Final energy consumption is energy supplied to meet the demand of the final consumers and is calculated as the sum of final energy consumption from all sectors, namely industry, transport, agriculture, households, and other sectors.
The indicator “Final energy consumption by sector” is expressed in thousand tonnes of oil equivalent (ktoe) and in percentage as a ratio between final energy consumption by each sector and final energy consumption by all sectors.
- thousand tonnes of oil equivalent (ktoe)
- percentage (%)
Is final energy consumption increasing and in which sector it is the highest?
Policies in energy sector should favour measures aimed at rational and efficient energy consumption, especially by households and industry.
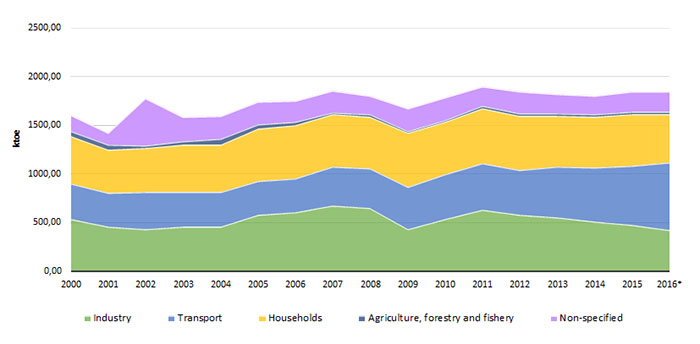
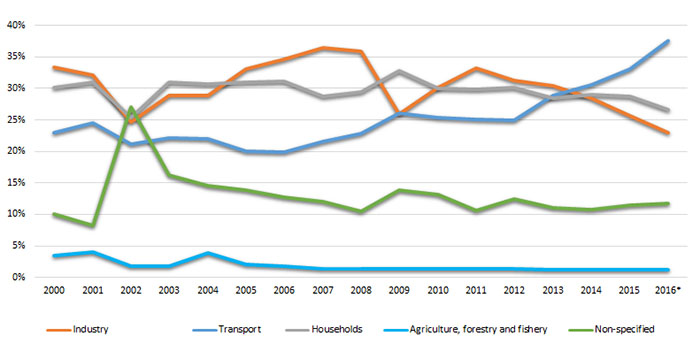
During the period between 2000and 2016, final energy consumption in the Republic of Macedonia increased by 15.5%. If we compare the energy consumption in 2016 with respect to 2000, it is noted that the increase in the final energy consumption is the highest in the transport sector by 89%, while in the industry it is decreased by 20.3%, and in the households there is an increase of 1.7%. In 2016, the largest share in the final energy consumption is noted for the transport sector with 34.9%, the households with 24.7% and the industry with 24.7%.
Figure 1. Final energy consumption by sector
Figure 2. Share of individual sectors in final energy consumption
Data coverage: excel
Source: State Statistical Office, http://www.stat.gov.mk/Default_en.aspx
In the period from 2000 to 2016, the final energy consumption in the Republic of Macedonia increased by 15.5%.
By analyzing data on final energy consumption, it can be noted that the largest drop in final energy consumption in he sector industry is in 2016, and the highest increase in consumption in the sector industry is noted in 2007.
Comparing 2016 with the year 2000, it can be noted that the final energy consumption in transport has a steady increase with a rise in 89%, while in the households sector there is increase by 1.7%.
The largest share in the final energy consumption in 2016 is from the transport sector with 34.9%, households with 24.7% and the industry with 24.7.
- Methodology for the indicator calculation
Statisticalmethodologyforcalculation:
- Regulation on Energy Statistics of the European Parliament and of the Council (Regulation no.1099/2008).
- “Energy Statistics Methodology Eurostat F4, 1998″
- National classification of activities, Rev.2 (Official Gazette of the Republic of Macedonia no. 147/2008)
- Strategy for Energy Efficiency Promotion in the Republic of Macedonia by 2020[1]
- Strategy for Energy Development in the Republic of Maceodnia by 2030.[2]
Legal grounds
Law on Energy; Energy Balance of the Republic of Macedonia – annual planning document defining the demands for energy and the possibility for their supply.
[1] http://www.konkurentnost.mk/StrateskiDokumenti/StrategijazaunapreduvanjenaEERMdo2020godina.pdf
[2] http://www.build.mk/docs/users/cloverstack/Strategija%20za%20razvoj%20na%20energetikata%202008-2020%20so%20vizija%20do%202030.pdf
- Eurostat
- ECE/UN
- IEA/OECD
| Code | Title of the indicator | Compliance with CSI/ЕЕА or other indicators | Classification by DPSIR | Тype | Linkage with area | Frequency of publication | |
| MKNI 027 | Final energy consumption by sector | CSI 027
EE 18 |
Final energy consumption by sector | D | А | Energy | annualy |


