| GREENHOUSE GAS EMISSIONS |
The indicator shows the quantities of greenhouse gas emissions and sinks into/from atmosphere on national level. The emissions are presented by greenhouse gas type. The indicator provides information on emissions in the following sectors: energy, industrial processes and products use, agriculture, forestry and other land use (AFOLU) and waste.
- Kilotons CO2-еquivalent
The aggregate GHG emissions and removals (net emissions) are estimated 9,023 Gg CO2-eq in 2014 (including the FOLU sector). The Figure 1 shows the time series of the emissions (emissions reduced for the removals), in CO2-eq, from 1990 to 2014. Significant fluctuations in the net emissions can be seen in 2000, 2007, 2008 and 2012, where increased CO2 emissions can be noticed in FOLU sector (instead removals) as a result of the intensified forest fires/wildfires.If the emissions and removals from FOLU sector are not accounted for, then the total GHG emissions are 12,204 Gg CO2-eq in 2014 (Figure 2). The dominant share of emissions from the Energy sector is evident throughout the whole time series.
According to the level assessment for 2014, the top categories with the highest values of emissions (in kt CO2-eq) are: Energy Industries – Solid Fuels (22.8%, CO2 emissions), Solid Waste Disposal (11.4%, CH4 emissions), Road Transportation (8.2%, CO2 emissions), and Manufacturing Industries and Construction – Liquid Fuels (3.4%, CO2 emissions), while the category Forest Land Remaining Forest Land has the highest values of removals (35.1%, CO2 sinks).
Figure 1. Total net GHG emissions in kilotons CO2-equivalent (baseline 2000)
Figure 2. GHG emissions by sector in kilotons per year
|
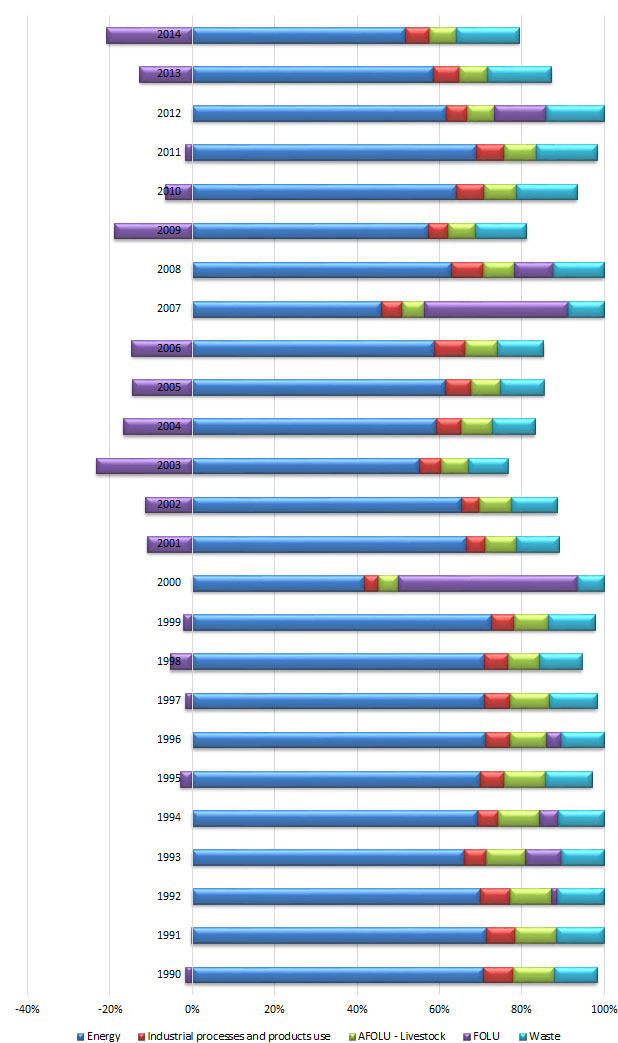
Figure 3. Share by sector of GHG emissions in % per year |
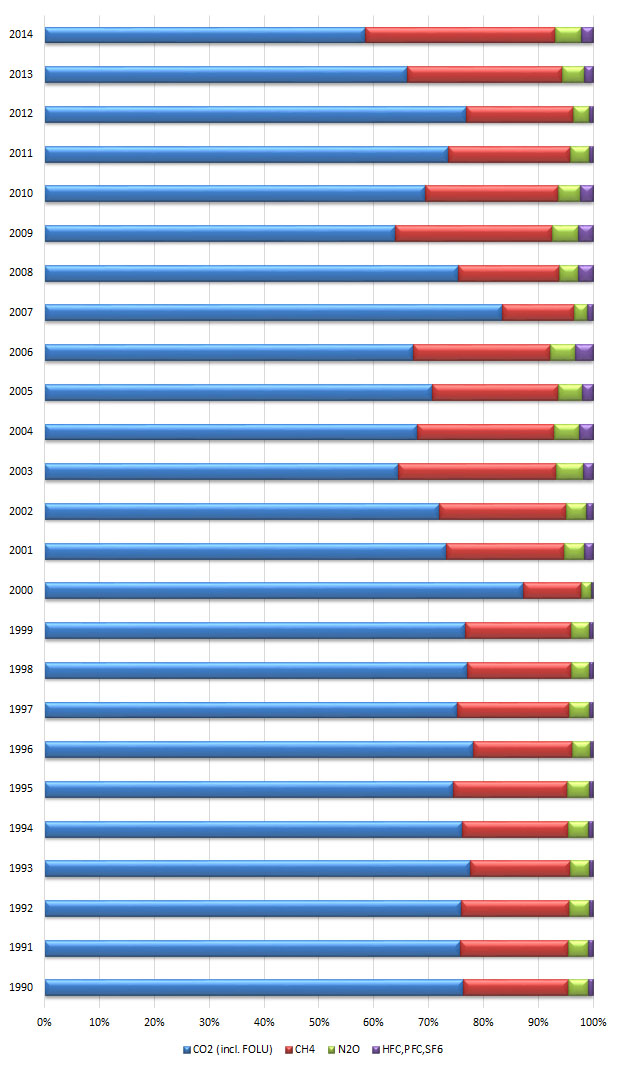
Figure 4. Share of individual pollutants in the total GHG emissions in % per year |
Data coverage: excel
Source: Second Biennial Update Report (SBUR) on Climate Change to UNFCCC (National Inventory Report (NIR) – RCESD – MASA), MoEPP, UNDP, 2017, www.unfccc.org.mk
In general, the greatest share in the total emissions (excluding the removals from Forestry and other land use sector) have the emissions from the Energy sector, accounting for 65.2% in 2014, followed by the Waste sector with 19% share, Agriculture (only emissions from manure management and enteric fermentation) with 8.2% and IPPU sector with 7.6%.
Considering the net emission (where the removals from Forestry and other land use sector are accounted for), again the Energy sector has the greatest contribution to the emissions, with of 88% in 2014, followed by the Waste sector with share of 26%, then emissions from Agriculture (only from manure management and enteric fermentation) with share of 11% and the emissions from Industrial processes and product use with 10%. The Forestry and other land use sector contirubutes to the removal of the GHG with -35% share (Figure 3).
The GHG inventory in the Energy sector accounts for the emissions released as a result of fuel combustion activities in in the following categories: Energy Industries, Manufacturing Industries and Construction, Transport, Other sectors (Commercial/Institutional, Residential and Agriculture/Forestry/Fishing) and Non-Specified. In addition, the Fugitive emissions from extraction of lignite, oil refining and transmission of natural gas have been calculated. Therefore, the overall GHG emissions in Energy sector are 7,957.5 kt CO2-eq in 2014. Most of the GHG emissions in 2014 come from the category Energy Industries (59.7%), then from the Transport (20.5%) and Manufacturing Industries and Construction (14.2%). The other two categories together account for 3.8% of the total emissions in 2014 and the remaining 1.8% are Fugitive emissions.
The GHG emissions in the IPPU sector in Macedonia come either from the manufacturing industries or the usage of ozone-depleting substances (ODS) substitutes for refrigeration and air-conditioning. The metal industry is the main contributor with dominant level of emissions from the ferroalloy production. This category is followed by the mineral industry where most of the emissions come from cement production. The rest of the emissions are a result of ODS substitutes usage in the country. Only small portion of emissions come from the chemical industry sector as there are no significant factories that produce chemicals. The level of the overall greenhouse emissions from this sector is consistent throughout the entire period of 1990-2014, where the emissions from manufacturing industries follow generally decreasing trend, while emissions from product use follow increasing trend over the observed years. The emissions in in 2014 it amount to 921.6 kt CO2-eq.
The GHG emissions from the AFOLU sector include emissions associated with Livestock, Forestry and Land Use. Activities related to Livestock production emit CH4 and N2O. The CH4 emission is caused by enteric fermentation during herbal digestion in ruminants but also N2O emission occurs during the metabolic processes. Additionally N2O is emitted as a result of manure storage and processing (management). The emissions due to livestock activity in 2014 were 673.7 kt CO2-eq. Emissions of land use were evaluated throughout forest land, cropland, grassland, wetland, settlements and other land. Forestry sector is the major contributor of GHG sinks in Macedonia, with exception of several years (2000, 2007, 2008 and 2012) when the amounts of forest fires (burned areas) were significantly above the annual average. The average GHG sinks in this sector for 2014 is estimated on 3,471.2 kt CO2-eq. The Land category, despite the CO2 emissions and/or sinks, is characterized with non-CO2 emissions, particularly as a result of biomass burning, N2O emissions from managed soils, including indirect N2O emissions from additions of N to land due to deposition and leaching, and emissions of CO2 following additions of liming materials and urea-containing fertilizer. These emissions are estimated to be 328.2 kt CO2-eq in 2014.
The GHG emissions from the Waste sector cover the following categories: Solid Waste Disposal, Biological Treatment of Solid Waste, Incineration and Open Burning of Waste and Waste Water Treatment and Discharge. The overall emissions from this sector are estimated to 2,323.5 kt CO2-eq in 2014. The Solid Waste Disposal emissions are most significant accounting for 94.4% of the total waste emissions in 2014. The emissions from Incineration and Open Burning of Waste represent 1.4% of the total Waste emissions. The remaining 4.2% of Waste emissions come from Wastewater Treatment and Discharge (domestic and industrial).
Analyzing the net GHG emissions by gas (including the removals from FOLU sector), it is evident that across the series the most dominant are the CO2 emissions (Figure 4). Their share accounts for 58% in 2014, followed by the CH4 emissions with 35%, then N2O emissions with 5% and all F-gasses with 1.5%.
- Methodology for the indicator calculation
To calculate GHG emissionsas well as GHG inventories, the methodology provided by UNFCCC/IPCC is used.
Methodology is based on the calculation of GHGs as a product from the activity data for individual sectors and emission factors.
In the preparation of Macedonia’s National Inventoryunder the Second Biennial Update Report, the Tier 2 method was applied for CO2 emission factors for lignite, residual fuel oil and natural gas for Fuel combustion activities in Energy sector. Tier 2 was also used in IPPU sector for emission factors in Mineral industry, for cement production and in Metal industry, for Iron and steel production and Ferroalloys production. The Waste sector is another sector with Tier 2 application, through IPCC FOD method and taking into account the country-specific activity data on waste disposal at solid waste disposal sites (SWDS) and the historical data on GDP and population. For the other sectors the default method, Tier 1, was used.
The analysis of key categories that contribute the most to the absolute level of national emissions and removals (level assessment) and to the trend of emissions and removals (trend assessment), was conducted using the Approach 1. According to this approach, key categories are those that, when summed together in descending order of magnitude, add up to 95% of the total level/trend.
In the SBUR, the uncertainty analysis for the first time was conducted using both methods, Approach 1 (Error Propagation method) and Approach 2 (which is actually an implementation of the Monte Carlo method), for all sectors of the inventory for 2012, 2013 and 2014.
The Grenhouse Gases Inventory establishes the basis for the analysis of the GHG reduction.
Legal grounds
Republic of Macedonia is a Party to the United Nations Framework Convention on Climate Change and to the Kyoto Protocol. Climate change issues have been incorporated in the Law on Environment, including the requirements for preparation of GHG emission inventories and GHG removal via sinks, as well as development of action plan with measures and activities aimed at GHG emissions abatement and climate change impacts mitigation. In addition to this, by means of amendment of the Law on Environment, provision has been made for Designated National Authority to approve the projects under the Kyoto Protocol Clean Development Mechanism.
UNFCCC
| Code | Title of the indicator | Compliance with CSI/EEA or other indicators | Classification by DPSIR | Type | Linkage with area | Frequency of publication | |
| MK NI 010 | Greenhouse gases emissions and removals | CSI 010 | Greenhouse gases emissions and removals | P | B
|
|
Annually |


