MK – NI 026


AREAS UNDER ORGANIC FARMING smile1 strelki r eng
Definition

The indicator is calculated as share (percentage) of area under organic farming (sum of existing areas under organic farming and areas in a process of conversion for organic farming) in the total area or total cultivable land area.

Units

The indicator is presented as sum of area under organic farming and area being converted for organic farming, measured in ha. Share of organic farming is given as a percentage of total utilized agricultural area.

Key policy issue

Whether the share of organic cultivable area in the total cultivable area is in increase?

Key message

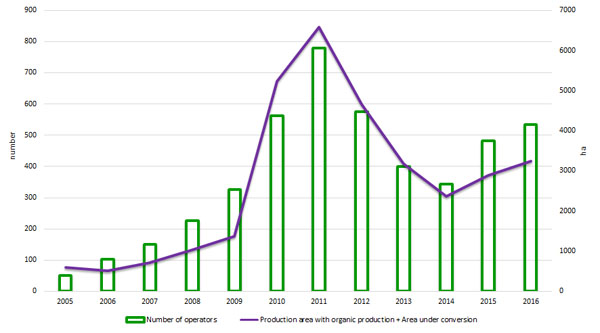
In the period under review, the production areas and areas under organic production have a variable trend of growth and decline. Production areas with organic production have a positive trend with increase of 7.8 times, from 266 hectares in 2005 to 2.073,37 hectares in 2016. The areas under conversion have the largest increase, by 17 times in the period from 2005 to 2011, and the largest decline in the period from 2011 to 2014. A positive trend in increase of the areas under conversion occurs again in 2015 and 2016, and thus compared to 2014 there is a 28 % growth noted in 2016.

The dynamics of the total certified production area with organic agricultural production, follows the above stated dynamics of increase and decrease in the number of organic operators, over the years.

In relation to the target of 4% set for 2020, we could note that the share of organic production in relation to the total arable agricultural area, is still minor with only 0.26%.


Figure1. Area under organic agricultural production

CSI_Zemjodelstvo2018_026_EN.gr1


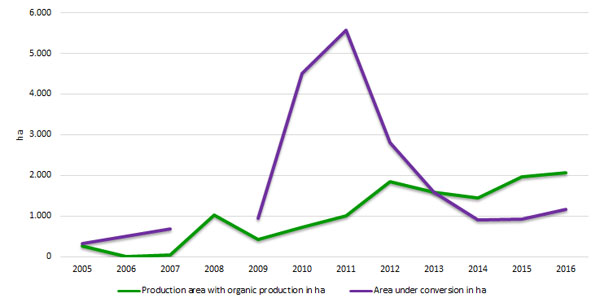
Figure 2. Share of area under organic agricultural production in cultivable and total agricultural area


CSI_Zemjodelie2018_026_EN_gr2


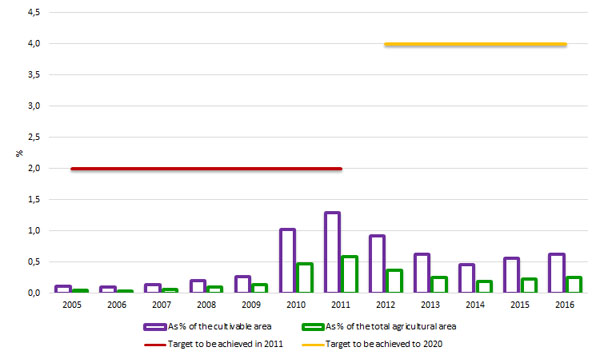
Figure 3.Organic vegetable production in haby type of culture


CSI_Zemjodelstvo2018_EN_gr3


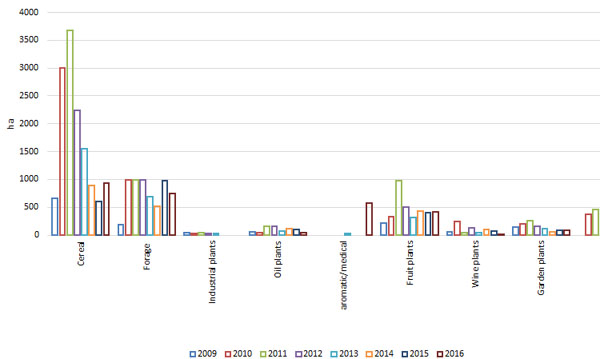
Figure 4. Ratio between the number of operators and the area under organic agricultural production


CSI_Zemjodelstvo2018_026_EN_gr.4


Data coverage: excel

Source: Statistical Yearbook, State Statistical Office, Ministry of Agriculture, Forestry and Water Economy, Division of Organic farming.

Assessment

During the period under review, the production areas and areas under organic conversion have a variable trend of growth and decline. Production areas with organic production have a positive trend with increase of 7.8 times, from 266 hectares in 2005 to 2.073,37 hectares in 2016.

The areas under conversion have the largest increase in the period from 2005 to 2011, from 326,54 hectares in 2005 to 5.573,66 hectares in 2011, meaning a 17 times increase. But then, in the period from 2011 to 2014, there is a huge decline in the areas under conversion, from 5.573,66 hectares to 910.88 hectares, which points to the fact that during this period the areas under conversion have been significantly reduced. A positive trend of increase of the areas under conversion is noted again in 2015 and 2016. Compared to 2014, in 2016 the areas under conversion increased by 28%.

The share of total area under organic agricultural production (production + conversion) in the total arable land, increased from 0.109% in 2005 to 1.288% in 2011, while in 2012 the share decreased and it was 0.914%, whereas the negative trend continued until 2014. From 2014 to 2016, we would note a further increase in the area of organic agricultural production, in the total arable land. In 2016, compared to 2014, the share increased to 0.63%, but unfortunately, compared to 2011 when it had the largest share, the share in 2016 declined by 51%.

The share of organic agricultural production areas in the total arable land is insignificant, taking into account the National Plan for organic production 2013-2020, in which until 2020, the objective is for organic arable land to be 4% in the total arable land in Republic of Macedonia, which in 2016 is only 0.26%.

Figure 3 shows that grain cultures are the leading organic cultures in Republic of Macedonia in 2016, with a share of 28.96%, followed by forage crops with 23.12%, while the vineyards are with participation of 0.54% in the total certified areas.

The number of certified organic operators in the period from 2005 to 2011 increased in proportion with the growth of areas under organic agricultural production (figure 4), yet it declined from 2012 to 2014, and again having an increase of 54.9% in the period from 2014 until 2016.

Methodology

The method of the European Environmental Agency.

The indicator is presented as sum of area under organic farming and area being converted for organic farming, divided by the total cultivable land area or total agricultural area. This value is multiplied by 100 in order to present the value in percentage.

Policy relevance of the indicator

List of relevant political documents

  • National strategy with action plan for development of organic farming in the Republic of Macedonia 2008-2011
  • Strategy for agriculture and rural development – condition and need to establish agro-environmental policy.
  • The Strategy for compliance of the Macedonian agricultural and food sector with the EU Common agricultural policy – indicates the need to identify the regions suitable for organic farming and to comply with the European regulations.
  • The Treaty with the World Trade Organization – improvement of the international food safety standards
  • The Second National Environmental Action Plan – strives to include environmental issues directly in the agricultural development policy and to maintain the natural resources needed for sustainable development on high level. In accordance with this, a control and certification body for organic agricultural production, recognized by the EU has been defined and established.
  • National strategy for biodiversity with Action Plan
  • National strategy for sustainable development

Legal grounds

The framework for the organic farming is established by the Law on Organic Farming and regulations which are in a process of adoption; the Law on Stimulating Agriculture Development, Law on Environment and Law on Nature Protection.

The provisions of this Law have been harmonized with international and European ones, especially with EU Regulation No.2092/91, which is of particular importance in the context of future development of trade exchange in organic products with European countries.

Targets

In 2011, the organic cultivable land has a 2% share in the total cultivable land in Macedonia.

In 2011, while the wild collection area has a share of 5% in the total cultivable area in Macedonia.

Reporting responsibilities
  • Annual report for quality of the environment in the Republic of Macedonia
  • Environmental statistics
  • European Environment Agency
General metadata
Code Title of the indicator Compliance with CSI/ЕЕА or other indicators Classification by DPSIR Тype Linkage with area Frequency of publication
MKNI 026 Area under organic farming CSI 026

IRENA 07

Area

under organic farming

R A agriculture

biological diversity

Annually
Last modified: Wednesday November 23rd, 2022