| PROJECTIONS OF GREENHOUSE GAS EMISSIONS |
The indicator illustrates projected trends in anthropogenic greenhouse gas (GHG) emissions by means of application of the existing policies and measures (Mitigation scenario, with existing measures – WEM) and/or additional policies and measures (Higher ambition mitigation scenario, with additional measures – WAM). Projected trends are presented by sector types: energy, industrial processes, agriculture, forestry and other land use and waste.
- Tons CO2-equivalent.
According to specific emissions (кt CO2-eq per capita), Macedonia will have an upward trend in each of the three scenarios and in the mitigation scenarios it would grow at a lower rate than in the Reference Scenario. Thus, the value of this indicator in the WAM scenario increases by 16% in 2035. That means that every citizen of Macedonia in 2035 will create 7.5 t CO2-eq, and in 2012 it created 6.5 t CO2-eq. According to these forecasts, in 2035, Macedonia will be somewhere between the EU (28) (8.75 t CO2-eq/capita) and Hungary (6.25 t CO2-eq/capita) in 2015.
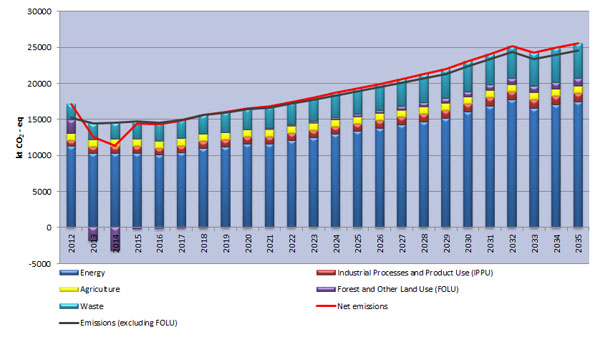
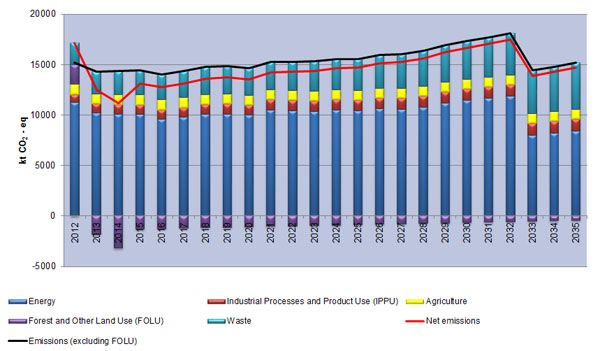
Figure 1: Projections of total GHG emissions [кt CO2-eq] – Reference scenario (Without Measures – WOM)
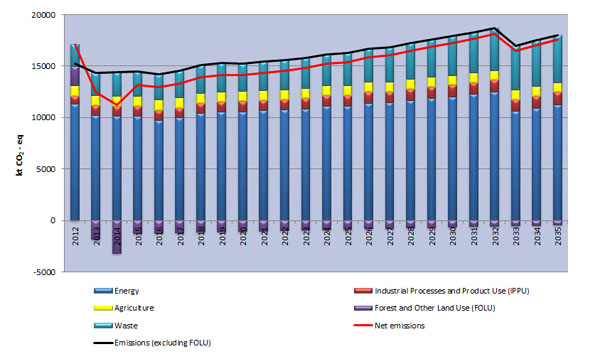
Figure2: Projections of total GHG emissions [кt CO2-eq] – Mitigation scenario (With Existing Measures – WEM)
Figure3: Projections of total GHG emissions [кt CO2-eq] – Higher ambition mitigation scenario (With Additional Measures – WAM)
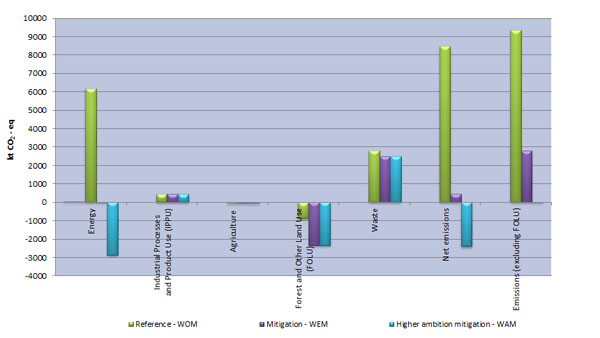
Figure4: Effectiveness of the three scenarios expressed as absolute emissions growth in 2035 relative to emissions in 2012
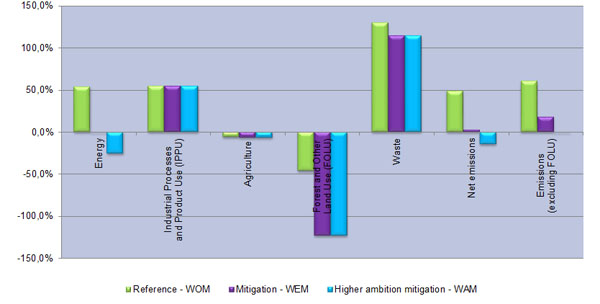
Figure5: Effectiveness of the three scenarios expressed as relative emissions growth in 2035 relative to emissions in 2012
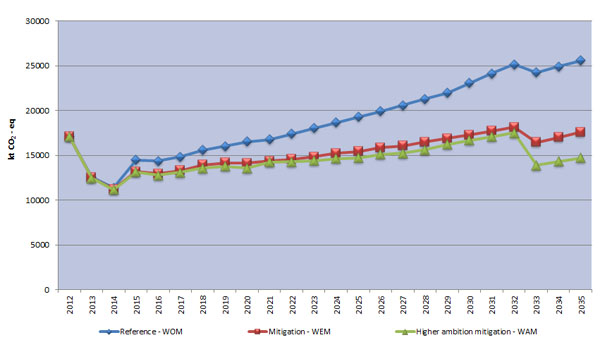
Figure6: Projections of total net GHG emissions for the three scenarios [кt CO2-eq]
Data coverage: excel
Source: Second Biennial Update Report on Climate Change to UNFCCC (Report on Mitigation of Climate Change – RCESD – MASA), MoEPP, UNDP, 2017, www.unfccc.org.mk
The climate change mitigation analysis conducted in the Second Biennial Update Report (SBUR) builds upon and continues the analyses of previous studies: Third National Communication (TNC), First Biennial Update Report (FBUR) and the Intended Nationally Determined Contributions (INDC)[1].
In order to assess the mitigation potential of certain measures and policies, all sectors recognized by the Intergovernmental Panel on Climate Change (IPCC) methodology (Energy, Industrial Processes and Product Use, Agriculture, Forestry and Other Land Use and Waste) have been modelled in the SBUR. The modelling has been conducted for the period from 2012 to 2035.
Taking into account the changes in development which occurred in the meantime, the Reference scenario, reflecting a case with no implemented mitigation measures is firstly revised as a Scenario Without Measures (WOM scenario). This scenario has no likelihood of occurrence because it implies, for instance, that the efficiencies of devises used in households in 2035 would be same as the efficiencies of the devises used in 2012. Nevertheless, creating such a scenario is of crucial importance because it allows all measures to be compared to one referent option and it allows for the comparison of the effects (financial, environmental, energy related) of a certain measure or policy to take place. When the yearly total emissions in the WOM scenario are calculated (Table 2 and Figure 1, a gradual rise from 2012 until 2035 is evident; the emissions in 2035 amount to 25,585 Gg CO2-eq which is a 49% increase compared to the emissions from 2012. The Energy sector continuously has the biggest share in the total net emissions, a share which in 2035 is estimated to be 68%, while the Waste sector has the biggest increase in emissions (around 130%).
Taking into consideration all national strategic and planning documents, over 50 mitigation measures were recognized out of which, with the participation of key actors, 46 measured were selected for modelling – 35 measures in the Energy sector, 8 measures in Agriculture, Forestry and Other Land Use (AFOLU) and 3 measures in the Waste sector. Each of these measures is represented with a separate table in the Mitigation report, containing all necessary information, progress of implementation (timeframe, expected results and costs, implementing entity) and progress indicators.
From the list of measures, in collaboration with all relevant stakeholders, 35 measures/policies were marked as measures/policies with high realization probability because they deal with projects that have been started/are going to start in near future, are prioritized projects/policies in sectoral strategic and planning documents or have resulted from already passed laws or laws that will be passed in near future. These measures are included in the Mitigation Scenario which is also called the Scenario with Existing Measures (WEM). Another Higher ambition mitigation scenario has been created, which along with the existing measures contains additional measures/policies, thus obtaining the name Scenario with Additional Measures (WAM).
As a result of the proposed measures in the Scenario with Existing Measures (WEM) and the Scenario with Additional Measures (WAM), the total GHG emissions in 2035 drop by 25.2% (Table 3 and Figure 2) and 27.8% (Table 4 and Figure 3) respectively, when compared to the Reference scenario (WOM). The GHG emissions occurring in WEM in 2035 are only 2.6% higher than in 2012, while the 2035 emissions in WAM decrease by 14% when compared to 2012 (Table 7, Figure4 and Figure 5). Both scenarios’ peaking year occurs in 2032 when the emissions are 18,130 CO2-eq according to the WEM scenario and 17,510 CO2-eq according to the WAM scenario (Table 5 and Figure 6). The Energy sector still dominates with its share in the total emissions (60.9% in WEM and 53.8% in WAM in 2035), but compared to the Reference scenario, the emissions of the WEM scenario decrease by 25% and the emissions in the WAM scenario decrease by 29% in 2030. Hence, the majority of the suggested mitigation measures and policies are related to the Energy sector.
Another important indicator is CO2 emissions per capita, according to which Macedonia falls in the same category as Romania and Hungary, as a country with relatively low emissions per capita. In the Reference Scenario this indicator will have an increasing trend, while in the mitigation scenarios it would grow at a lower rate than in the Reference Scenario (Table 6). In the calculation of this indicator, emissions from Forestry and other land use are excluded from the total emissions of each scenario (in order to make a comparison of the development of Macedonia with the EU (28) and the countries of Southeast Europe) and then are divided by the forecasted population.
[1] All documents are available on this link: http://klimatskipromeni.mk/Default.aspx?LCID=213
- Methodology for the indicator calculation
In comparison to the previous studies, significant improvements and upgrades can be attributed to the modeling in the SBUR, among which are: harmonization of all sectors and categories with the IPCC methodology (the sectors are identical as in the Greenhouse Gases (GHG) inventory) so that trends can more easily be followed; use of a single methodology for GHG emission calculations in all sectors (IPCC methodology); integration of the separate models of all sectors[1] by introducing intersectoral connections on the basis of key drivers which are common for all sectors; use of a unified methodology when creating mitigation policies/measures which allows an integrated preview of the results through two scenarios (Mitigation scenario – Scenario with Existing Measures and a Higher ambition mitigation scenario – Scenario with Additional Measures) etc. In addition to these improvements and upgrades in the modelling, the private sector and the public administration were actively included in the process of preparing and choosing the measures and policies. In that regard, a number of meetings were organized in order to ensure acquaintance and alignment of the attitudes of different actors towards the suggested measures and policies.
[1] In previous national reports on climate change, the analysis of some sectors were conducted with MARKAL, some with GACMO, others according to other methodologies and all of them used different input data.This indicator is of vital importance for the national climate change mitigation policy. It is also related to future implementation of projects based on the Clean Development Mechanism (CDM) of the Kyoto Protocol.
Legal grounds
Republic of Macedonia is a Party to the United Nations Framework Convention on Climate Change and to the Kyoto Protocol. Climate change issues have been incorporated in the Law on Environment, including the requirements for preparation of GHG emission inventories and GHG removal via sinks, as well as development of action plan with measures and activities aimed at GHG emissions abatement and climate change impacts mitigation. In addition to this, by means of amendment of the Law on Environment, provision has been made for Designated National Authority (DNA) to approve the projects under the Clean Development Mechanism (CDM) of the Kyoto Protocol.
- UNFCCC
| Code | Title of the indicator | Compliance with CSI/ЕЕА or other indicators | Classification by DPSIR | Type | Linkage with area | Frequency of publication | |
| MK NI 011 | Projections of GHG emissions | CSI 011 | Projections of GHG emissions and removals | P | A
|
|
Annually |


