| EXCEEDANCE OF AIR QUALITY LIMIT VALUES IN URBAN AREAS – By monitoring station |
This indicator shows:
- Number of days during year when the level of air pollution (for the pollutants: suspended particulate matters sized up to 10 micrometers (PM10),sulphur dioxide (SO2), nitrogen dioxide (NO2), and ground ozone (O3)) exceeds the prescribed limit values (maximum permissible annual and short-term concentrations in urban areas where regular observation of air quality is performed).
- Portion of urban population living in urban areas with at least one monitoring station) in the country exposed at air pollution above the set limit values.
- Absolute values of the concentration of pollutants in the air.
Number of days
Ambient air concentrations of sulphur dioxide (SO2), particulate matter sized up to 10 micrometer (PM10), nitrogen dioxide (NO2) and ozone (O3) are expressed in microgram/m3 (µg/m3).
What progress has been achieved in reducing the concentrations of pollutants in urban areas in order to achieve the limit values (for SO2, PM10, NO2) and target values (for O3) set in the Decree?
Suspended particulate matters sized up to 10 micrometers (РМ10)
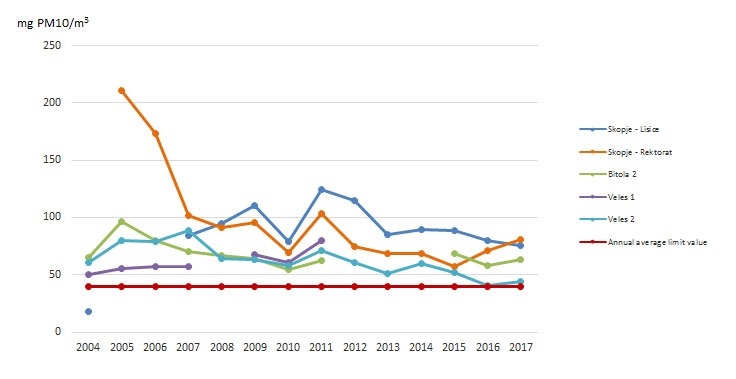
Concentrations of suspended particulate matters sized up to 10 micrometersexceed limit values specified in the Decree at the analyzed measuring points. High concentrations of suspended particulate matters sized up to 10 micrometers occur frequently, especially during winter period. Highest concentrations of PM10 have been measured in Skopje.
Nitrogen dioxide (NO2)
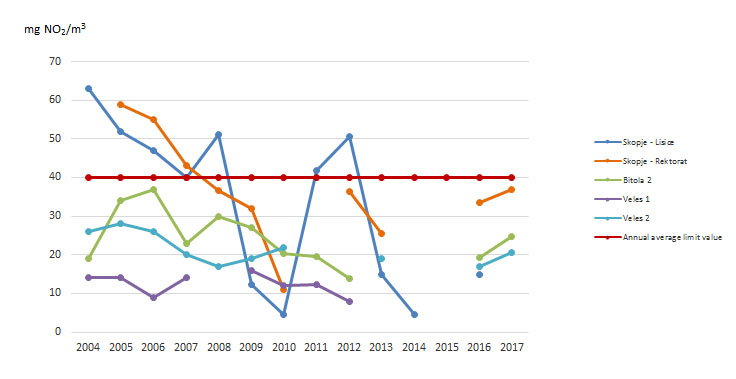
In the period 2004 to 2017, decreasing trend was observed for the concentrations of nitrogen dioxide. Measured concentrations of this pollutant exceed specified limit value only in Skopje.
Sulphur dioxide (SO2)
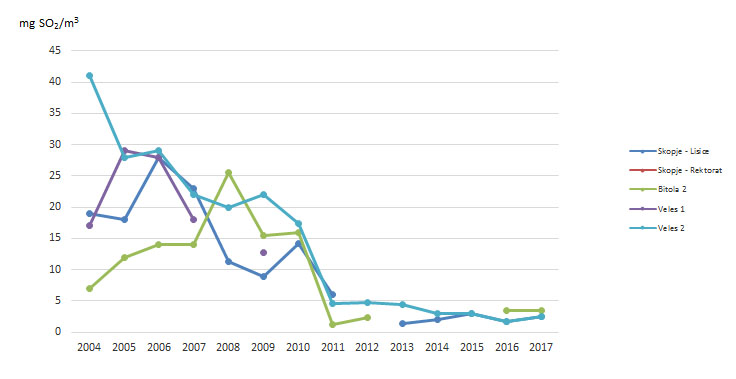
In the period 2004 to 2017, decreasing trend was observed for themean annual concentration at all measuring points. Also, the mean daily limit value for sulphur dioxide was not exceeded, i.e. population was not exposed at concentrations of sulphur dioxide above the limit value at all analyzed measuring points.
Ozone (О3)
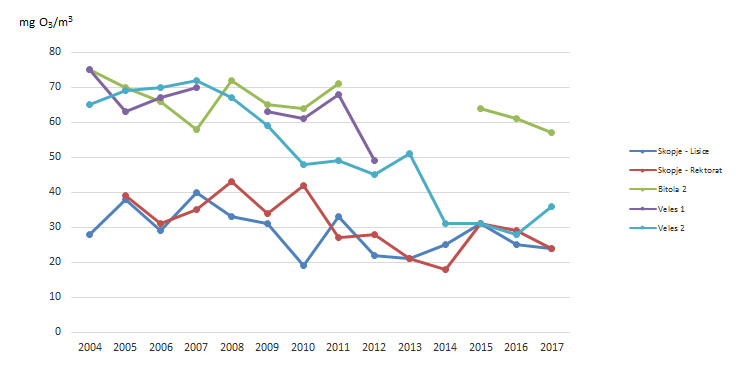
In the period 2004 to 2017, the highest concentrations of ozone were recorded in Bitola, due to the fact that the city is situated in southwestern part of the country with higher number of sunny days during the year. Ozone concentrations measured in Skopje throughout the analyzed period were significantly lower compared to ozone concentrations measured in Bitola and Veles.
Diagram 1: Mean annual concentration of РМ10
Diagram 2: Mean annual concentration of NO2
Diagram 3: Mean annual concentration of SO2
Diagram 4: Mean annual concentration of O3
Data coverage: excel
Source: Ministry of Environment and Physical Planning (https://arhiva.moepp.gov.mk/?lang=en)
Suspended particulate matters (PM10)
Suspended particulate matters of size up to 10 micrometers are particles able to pass through an opening conducting selection by size, with 50% loss in efficiency at aerodynamic diameter of size less than ten micrometers (10 μm). These particles of size not exceeding 10 micrometers are the so called fine particles or aerosols. Their retention time in the air is long and they originate from natural and anthropogenic sources. Among natural sources, the more prominent include yellow rains, present also with us, forest fires and chemical reactions going on in nature. Combustion of coal, wood and oil, industrial processes, transport and waste burning are the most significant anthropogenic sources.
Increased concentrations of suspended particulate matters can be recorded in urban areas, especially in autumn-winter seasons, which is most probably due to increased frequency in traffic, fossil fuels combustion and meteorological conditions.
Based on data processed for the period 2004-2017, we may conclude that throughout the period, the population was exposed at concentrations of suspended particulate matters exceeding limit values (mean limit value of 50 mg/m3 which should not be exceeded in more than 35 days during a calendar year and annual limit value of 40 mg/m3). Highest concentrations of this pollutant were recorded in Skopje, which was most probably due to human lifestyle, dense population, intensive use of solid fuel for households heating during winter, as well as impacts of industry.
Nitrogen dioxide (NO2)
Investigations have testified the presence of several nitrogen oxides in the air, but the most significant among them are nitrogen dioxide and nitrogen monoxide. These pollutants most often originate from natural sources. However, in urban environments, the main source is the traffic, and industry is minor source. The most toxic of all nitrogen oxides is the nitrogen dioxide, the concentrations of which are dependent on season and meteorological conditions. Namely, concentration of NO is higher in morning hours when the traffic is more frequent, while the intensification of solar radiation during the day leads to transformation of NO into NO2 resulting in increased concentration of NO2. Nitrogen oxides influence the content of ozone and other photochemical oxidants in the air. During the spring-summer period, the concentration of NO2 is higher, while in autumn-winter period, the concentration of NO is higher. The quantity of NOx increases in winter period due to the higher frequency of traffic.
Data processed indicate that the mean annual concentration of nitrogen dioxide was exceeded only in Skopje, which was most probably due to high frequency of traffic and operation of industrial facilities.
Sulphur dioxide (SO2)
Sulphur dioxide in the air most frequently originates from major thermal power plants, as well as from small and medium size boilers for coal combustion in urban environments. The main anthropogenic sources include coal and oil combustion. This pollutant is also released in the air from industrial processes (production of cellulose and paper, sulphuric acid, lead and zinc ores smelting).
In the period 2004 to 2017, there was no exceeding of the mean daily limit value for sulphur dioxide, i.e. population was not exceeded at concentrations of sulphur dioxide above the limit value at all analyzed measuring points.
Ozone – O3
Ozone layer is positioned at height of 10 km to 15 km from Earth and it plays the role of a filter for UV radiation and climate stabilizer.
Automatic monitoring stations measure the ground-level ozone formed as a result of photochemical reactions involving nitrogen oxides, volatile organic compounds (most frequently hydrocarbons), etc. However, its content is also dependent on solar radiation and annual seasons. Thus, higher ozone concentrations are observed in warmer days, especially during summer.
In the period 2004 to 2017, the highest concentrations of ozone were recorded in Bitola, due to the fact that the city is situated in southwestern part of the country with higher number of sunny days during the year. Ozone concentrations measured in Skopje throughout the analyzed period were significantly lower compared to ozone concentrations measured in Bitola and Veles.
- Methodology for the indicator calculation
Calculation of the indicator takes into account data from conducted measurements of the quality of the air in the following three cities: Skopje, Bitola and Veles, as the most representative sites reflecting the state of air quality in the Republic of Macedonia. Skopje was selected as capitol and the largest urban area in the country and big industrial centre. Bitola is second in size city and the largest thermal power plant REK Bitola is located in its vicinity and Veles as city with great historical industrial pollution.
For each selected urban station, the type of station is specified (urban background, station measuring air pollution from traffic, station measuring air pollution from industry). Then, the following is calculated for each pollutant from the available hourly data: mean annual concentration, highest mean daily concentration and number of days with exceeded mean daily limit value.
Uncertainty
- Methodological uncertainty and data uncertainty
Calculations of the indicator have also taken into consideration stations where data coverage is below 75% per calendar year.
List of relevant policy documents
The National Plan for Air Protection presents the state of air quality, defines the measures for ambient air quality protection and improvement in the Republic of Macedonia and all relevant institutions responsible for their implementation within 5 year period, namely from 2013 to 2018 (Official Gazette of the Republic of Macedonia no.170/2012).
Legal grounds
The Law on Ambient Air Quality was adopted in August 2004 and later amended on several occasions in line with the requirements of the relevant EU legislation (Official Gazette of the Republic of Macedonia Nos. 67/2004, 92/2007, 83/2009, 35/2010, 47/2011 and 59/2012, 163/13, 10/15 and 146/15) and it is framework law in the area of air. The main goals of this Law are: avoidance, prevention and reduction of harmful effects on human health and environment as a whole, prevention and reduction of pollution resulting in climate change, as well as provision of the relevant information on the quality of ambient air. This Law establishes the legal grounds for adoption of a number of bylaws in line with the requirements of the relevant Acquis Communitaire. So far, 12 bylaws have been adopted. Calculations for this indicator are based on the provisions of the Decree on the limit values of levels and types of polluting substances in ambient air and on the alert thresholds, deadlines for the limit values achievement, margins of limit value tolerance, target values and long-term ozone targets (Official Gazette of the Republic of Macedonia No. 50/05, 4/2013 and 183/2017).
The Decree on the limit values of levels and types of polluting substances in ambient air and on the alert thresholds, deadlines for the limit values achievement, margins of limit value tolerance, target values and long-term targets, defines the limit values for SO2, PM10, NO2 and target values for O3.
Limit values for concentrations of sulphur dioxide in ambient air
In accordance with the said Decree, two limit values are specified for sulphur dioxide for the purpose of human health protection.
- Mean daily limit value of 125 µg/m3 which shall not be exceeded by more than three times during one calendar year
- Hourly limit value of 350 µg/m3, which shall not be exceeded by more than 24 times during one calendar year.
Limit values for concentrations of nitrogen dioxide in ambient air
In accordance with the said Decree, two limit values are specified for nitrogen dioxide for the purpose of human health protection.
- Hourly mean concentration of nitrogen dioxide shall not exceed the limit value of 200 μg/m3 by more than 18 times during one calendar year.
- The mean annual concentration shall not exceed 40 μg/m3.
Limit values for concentrations of suspended particulate matter of size up to 10 micrometers in the ambient air
The said Decree specifies two limit values for suspended particulate matter of size up to 10 micrometers, for the purpose of human health protection.
- 24-hourly limit value is 50 μg/m3,and it shall not be exceeded by more than 35 times during one calendar year
- The mean annual concentration shall not exceed 40 μg/m3.
Target values for ozone concentrations in ambient air
The said Decree, with regard to ozone, specifies target value for the purpose of human health protection and long-term target for the purpose of human health protection.
- The target value for ozone, for the purpose of human health protection, is specified so that 8-hourly mean value is calculated from the hourly concentrations in each day. The maximum daily 8-hourly mean value of ozone shall not exceed the value of 120 μg/m3 in more than 25 days in the course of the year (calculated as an average value for three years). This target value should be achieved by 2010.
- The Decree also defines long-term target for the purpose of human health protection, set at 120 μg/m3, as maximum daily 8-hourly mean value during a calendar year.
European Environmental Agency
- Air quality data exchange in accordance with implementing Decision containing the rules of Directives 2004/10/EC and 2008/50/EC of the European Parliament and of the Council concerning reciprocal exchange of information I reporting on ambient air quality (Decision 2011/850/EC).
| Code | Title of the indicator | Compliance with CSI ЕЕА or other indicators | Classification by DPSIR | Type | Linkage with area | Frequency of publication | |
| MKNI 004 | Exceedance of air quality limit values in urban areas – by monitoring station | CSI 004 | Exceedance of air quality limit values in urban areas | S | А | air
Air quality |
annual |


