МК – NI 054


ROAD MOTOR VEHICLES BY FUEL TYPE smile2 srelki d-eng
Definition

This indicator defines the number of motor vehicles broken down by road motor vehicle type (passenger cars, motorcycles, motor coaches and buses, commercial vehicles, operational vehicles, trailers and tractors) and fuel type (gasoline, diesel, mixture, gas oil, electricity) on national level.

Units
  • percentage (%).
Key policy question

What is the share of road motor vehicles by fuel type in the total number of road motor vehicles by vehicle type?

Key message

Emissions of polluting substances originate from almost all economic and social activities, and especially emissions from transport, contribute greatly to overall air emissions. Utilization of alternative energy sources, renewable sources, biofuel and natural gas are all primary processes for air quality improvement.

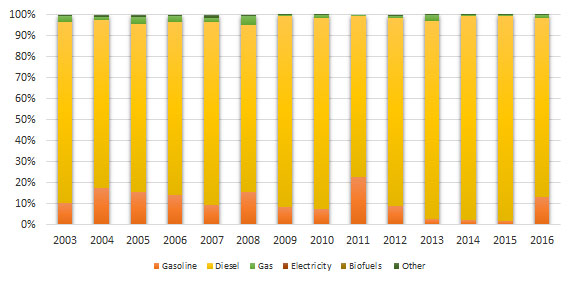
Use of gasoline by cars is the highest, though with falling trend of 27.05% during the analyzed period. At the account of decline in the use of gasoline, use of diesel has recorded increasing trend from 2.3% in 1995 to45.7% in 2016. Since air born particle emissions are higher in diesel combustion compared to petrol combustion, this trend of increased diesel consumption has negative impact to human health. Other types of fuel have very low share with growing trend and range from 0.5% in 1995 to2.9% in 2016.

With other types of vehicles – buses, goods vehicles, work vehicles, road tractors and tractors – diesel is dominant type of fuel with growing trend, followed by gasoline, except for motorcycles where the dominant type of fuel is gasoline..Other types of fuel have very low share with growing trend.


Figure 1. Share of passenger cars by fuel type in the total number of passenger cars

CSI_Transport2018_054_g1EN


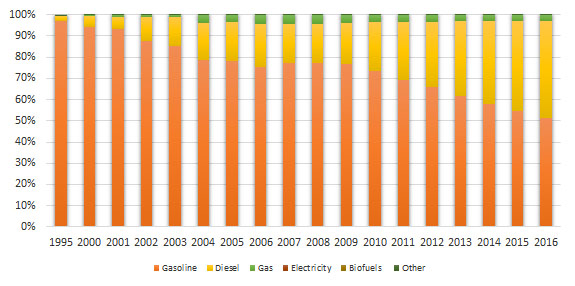
Figure2. Share of buses by fuel type in the total number of buses

CSI_Transport2018_054_g2EN


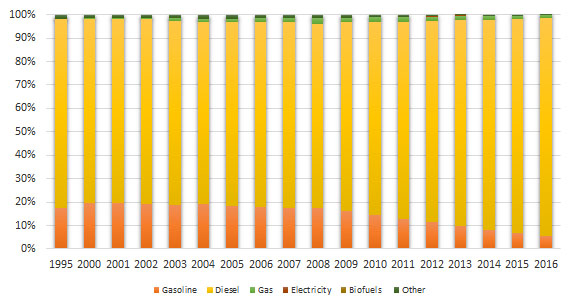
Figure3. Share of goods vehicles by fuel type in the total number of goods vehicles

CSI_Transport2018_054_g3EN

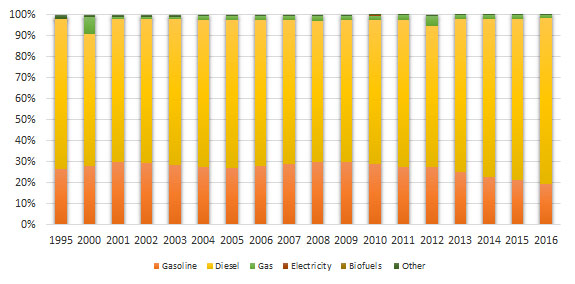
Figure4. Share of work vehicles by fuel type in the total number of work vehicles

CSI_Transport2018_054_g4EN

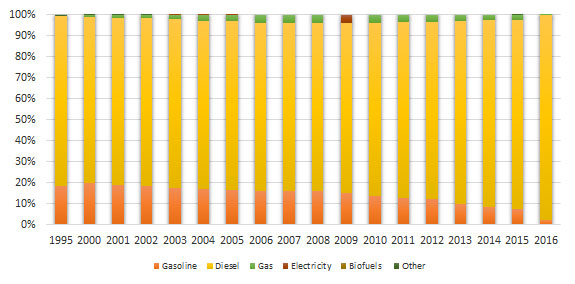
 Figure5. Share of motorcycles by fuel type in the total number of motorcycles

CSI_Transport2018_054_g5EN

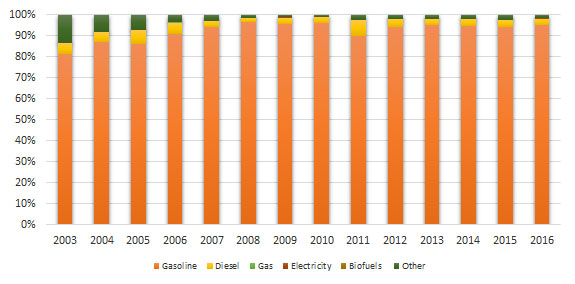
Figure6. Share of road tractors by fuel type in the total number of road tractors

CSI_Transport2018_054_g6EN

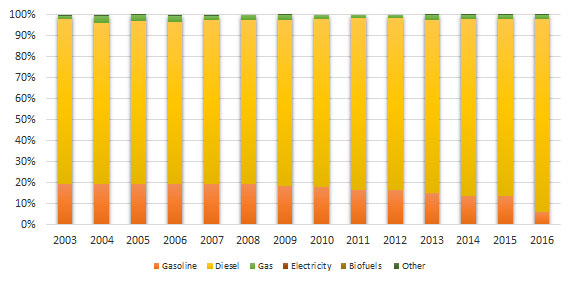
Figure7. Share of tractors by fuel type in the total number of tractors

CSI_Transport2018_054_g7EN


Data coverage: excel

Data source:  State Statistical Office, Ministry of Interior

http://www.stat.gov.mk/Default_en.aspx, http://mvr.gov.mk

Assessment

Emissions of polluting substances originate from almost all economic and social activities, and especially emissions from transport, contribute greatly to overall air emissions. Policies and strategies for air pollution reduction are aimed primarily at reducing emissions from transport (combustion of fossil fuels in vehicles). Utilization of alternative energy sources, renewable sources, biofuel and natural gas are all primary processes for air quality improvement.

Data during the reporting period indicate that use of gasoline in cars was the biggest, though with falling trend. In 1995, 97.2% of the cars used gasoline to fall at 51.3% of the cars in 2016. At the account of decline in the use of gasoline, use of diesel has recorded increasing trend from 2.3% in 1995 to45.7% in 2016, which does not assume improvement in terms of environment protection and reduction of air emissions. Other types of fuel have very low share with growing trend and range from 0.5% in 1995 to2.9% in 2016. The use of gas increased by 1160 times from 1995 to 2016.

With other types of vehicles – buses, good vehicles, work vehicles, road tractors and tractors – diesel is dominant type of fuel with growing trend, followed by gasoline, except for motorcycles where the dominant type of fuel is gasoline.

Use of diesel in motor coaches and buses recorded increase from 45.85% by 2016, and gasoline recorded drop from59.1% during the analyzed period. Other types of fuel have very low share in the overall use of fuels ranging between 0.3% and2.0%.

As far as trucks are concerned, use of diesel has almost constant share during the whole period, ranging between 67.2% and 78.2%; the same accounts for the use of gasoline with a range between 19.3% and30.1%. Gas noted variable trend of use with the greatest share of 8.1% in 2005 followed by drop during the entire analyzed period, recording 1.6% in 2016. Other types of fuel have very low share and range between 2.0% and0.1%.

With trailers, as with motor coaches and buses, use of diesel was the biggest with increase of 9.7% by 2016, while gasoline recorded decrease of 89.4% by 2016. Other types of fuel have very low share and range between0.01% and0.17%.


Methodology
  • Methodology for the indicator calculation

Data for the indicator is obtained from the number of road motor vehicles by fuel type and total number of road motor vehicles by type of motor vehicles and is calculated as share of the number of road motor vehicles by fuel type in the total number of road motor vehicles by type of motor vehicles. The sum of the shares (%) of all types of road motor vehicles by fuel should amount 100 (%), relative to total number of road motor vehicles by type of motor vehicles.

Policy relevance of the indicator

List of relevant policy documents

National Strategy for Transport prepared and adopted by the Government of the Republic of Macedonia determines the main directions of transport policy development in the Republic of Macedonia through identification of targets and strategy for development of road, railroad and air transport sector.

Legal grounds

  • Law on Road Transport (Official Gazette of RM no. 68/04, 127/06, 114/09, 83/10, 140/10, 17/11, 6/12, 23/13, 120/13, 163/13, 187/13, 42/14, 112/14, 166/14, 44/15, 97/15,124/15, 129/15, 193/15, 37/16and 71/16)
  • Law on Transport of Hazardous Matters in Road and Railroad Transport (Official Gazette of RM no. 92/07, 161/09, 17/11, 54/11, 13/13, 163/13, 38/14, 166/14, 116/15, 193/15and 31/16)
  • Law on State Statistics (Official Gazette of RM no. 54/97, 21/07 , 51/11 , 104/13, 42/14,192/15 and27/16)
  • Law on Road Transport Safety (Official Gazette of RM no. 169/15, 226/15, 55/16and11/18)
Target

The fourth target of the National Strategy for Transportis securing of sustainable protection of the environment.

Reporting obligation
  • EUROSTAT
General metadata
Code Title of the indicator Compliance with CSI/ЕЕА or other indicators Classification by DPSIR Тype Linkage with area Frequency of publication
MKNI 054 Road motor vehicles by fuel type D А Transport

Energy

Monthly

Periodically

Annually

Last modified: Monday November 28th, 2022